
Homework Answers
Comment: The p-value is 0.3366 and more than 0.02 level of significance. So, fail to reject the null hypothesis and can not accept the claim that the mean scores after a student takes the remedial class to be greater than 85.
Add Answer to:
QUESTION 1: In Minitab, Answer the following questions for the set of data below. It represents...
8. The following data are scores from a Physics final administered to 34 students. 81 76...
 8. The following data are scores from a Physics final administered to 34 students. 81 76 93 99 47 67 69 72 83 88 56 62 91 94 98 63 77 84 98 75 79 67 73 65 89 86 91 85 97 73 56 92 88 83 Use the Chart below to construct a Frequency Distribution with 5 classes (15 pts) Class Tally (This column is optional.) Frequency
Preliminary data analyses indicates that use of a paired t-test is reasonable. Perform the hypothesis test...
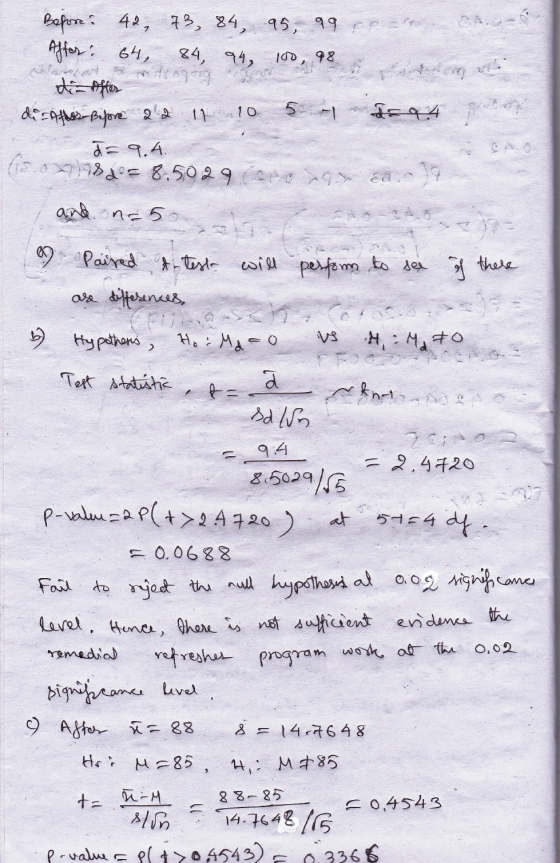
Preliminary data analyses indicates that use of a paired t-test is reasonable. Perform the hypothesis test by using either the critical-value approach or the P-value approach as indicated. Assume that the null hypothesis is Ho:u1=u2 Five students took a math test before and after tutoring. Their scores were as follows. subject A B C D E Before 73 66 76 69 72 After 77 75 74 72 84 At the 1% significance level, do the data provide sufficient evidence...
1. On the following page are the exam scores on the first Statistics test for all...
1. On the following page are the exam scores on the first Statistics test for all my classes. Using everything we covered in the first three chapters of our textbook, describe the data. I recommend going through your notes and textbook, chapter by chapter. Include as much as you can – type of data, frequency distribution, histogram, numerical methods, etc. The standard deviation for the data is 16.7. Exam Scores on the First Statistics Test 100 88 100 86 100...
I need answer on number 7 please 5. Students in a statistics class took their first...
I need answer on number 7 please 5. Students in a statistics class took their first test. The following table lists the scores they earned. 67 67 76 47 85 70 87 76 67 72 84 98 84 64 65 82 81 81 88 74 87 83 Complete the following frequency distribution table using 6 classes: 40-49, 50-59, 60-69, 70-79, 80-89, and 90-99. Scores Tally Frequency Relative Frequency Cumulative Relative Frequency 40 - 49 50 - 59 60 - 69...
please provide detailed answer thank you! Below are matched pair data consisting of customer service scores...
 please provide detailed answer thank you!
Below are matched pair data consisting of customer service scores for a sample of 10 employees before and after they watched an instructional video on their company's mission statement. At a 0.1 significance level, use the sign test to test the claim that viewing the instructional video affects the employees' customer service scores. Before After 52 57 46 47 46 48 60 58 36 38 38 41 56 58 38 41 61 64 38...
please provide detailed answer thank you!
Below are matched pair data consisting of customer service scores for a sample of 10 employees before and after they watched an instructional video on their company's mission statement. At a 0.1 significance level, use the sign test to test the claim that viewing the instructional video affects the employees' customer service scores. Before After 52 57 46 47 46 48 60 58 36 38 38 41 56 58 38 41 61 64 38...
A data set of test scores consisted of the following: 36 42 55 60 63 75...
 A data set of test scores consisted of the following: 36 42 55 60 63 75 77 78 79 80 83 83 84 84 85 85 86 87 91 91 92 94 99 On a stem-and-leaf display, the values of the tens digits (3-9) are: the trailing digits the leaves the less significant digits the stems
please provide detailed answer, thank you! The scores of 8 students on the midterm exam and...
 please provide detailed answer, thank you!
The scores of 8 students on the midterm exam and final exam were as follows. Final Student Anderson Bailey Cruz DeSana Erickson Francis Gray Harris Midterm 100 98 96 96 87 80 78 73 85 94 93 71 99 76 88 95 Find the value of the (Spearman's) rank correlation coefficient test statistic that would be used to test the claim of no correlation between midterm score and final exam score. Round your answer...
please provide detailed answer, thank you!
The scores of 8 students on the midterm exam and final exam were as follows. Final Student Anderson Bailey Cruz DeSana Erickson Francis Gray Harris Midterm 100 98 96 96 87 80 78 73 85 94 93 71 99 76 88 95 Find the value of the (Spearman's) rank correlation coefficient test statistic that would be used to test the claim of no correlation between midterm score and final exam score. Round your answer...
Consider the below matrixA, which you can copy and paste directly into Matlab.
Problem #1: Consider the below matrix A, which you can copy and paste directly into Matlab. The matrix contains 3 columns. The first column consists of Test #1 marks, the second column is Test # 2 marks, and the third column is final exam marks for a large linear algebra course. Each row represents a particular student.A = [36 45 75 81 59 73 77 73 73 65 72 78 65 55 83 73 57 78 84 31 60 83...
siness test before and after the course. The results are given below. Student Exam Score Before...
siness test before and after the course. The results are given below. Student Exam Score Before the Course Exam Score After the Course 1 630 770 2 690 770 3 910 1,000 4 750 710 5 450 550 6 840 860 7 820 770 8 630 610 9 580 585 (a) Use an appropriate hypothesis test, at 0.01 level of significance, to determine whether there is evidence of a difference between before and after scores of the students. (b) What...
PLEASE SHOW ME HOW TO DO THIS.... For the Excel Data Set please find and report...
 PLEASE SHOW ME HOW TO DO THIS....
For
the Excel Data Set please find and report for Test 1 and Test 2 the
Mean, SD, and the tolerance levels for both for which there would
be any outliers (i.e., the value for which a score must be less
than to be consider an outlier and the value for which a number
must greater than to be considered an outlier.
See picture
Performance Data Group 1 1 1 1 Test 2...
PLEASE SHOW ME HOW TO DO THIS....
For
the Excel Data Set please find and report for Test 1 and Test 2 the
Mean, SD, and the tolerance levels for both for which there would
be any outliers (i.e., the value for which a score must be less
than to be consider an outlier and the value for which a number
must greater than to be considered an outlier.
See picture
Performance Data Group 1 1 1 1 Test 2...
 8. The following data are scores from a Physics final administered to 34 students. 81 76 93 99 47 67 69 72 83 88 56 62 91 94 98 63 77 84 98 75 79 67 73 65 89 86 91 85 97 73 56 92 88 83 Use the Chart below to construct a Frequency Distribution with 5 classes (15 pts) Class Tally (This column is optional.) Frequency
 please provide detailed answer thank you!
Below are matched pair data consisting of customer service scores for a sample of 10 employees before and after they watched an instructional video on their company's mission statement. At a 0.1 significance level, use the sign test to test the claim that viewing the instructional video affects the employees' customer service scores. Before After 52 57 46 47 46 48 60 58 36 38 38 41 56 58 38 41 61 64 38...
please provide detailed answer thank you!
Below are matched pair data consisting of customer service scores for a sample of 10 employees before and after they watched an instructional video on their company's mission statement. At a 0.1 significance level, use the sign test to test the claim that viewing the instructional video affects the employees' customer service scores. Before After 52 57 46 47 46 48 60 58 36 38 38 41 56 58 38 41 61 64 38...
 A data set of test scores consisted of the following: 36 42 55 60 63 75 77 78 79 80 83 83 84 84 85 85 86 87 91 91 92 94 99 On a stem-and-leaf display, the values of the tens digits (3-9) are: the trailing digits the leaves the less significant digits the stems
 please provide detailed answer, thank you!
The scores of 8 students on the midterm exam and final exam were as follows. Final Student Anderson Bailey Cruz DeSana Erickson Francis Gray Harris Midterm 100 98 96 96 87 80 78 73 85 94 93 71 99 76 88 95 Find the value of the (Spearman's) rank correlation coefficient test statistic that would be used to test the claim of no correlation between midterm score and final exam score. Round your answer...
please provide detailed answer, thank you!
The scores of 8 students on the midterm exam and final exam were as follows. Final Student Anderson Bailey Cruz DeSana Erickson Francis Gray Harris Midterm 100 98 96 96 87 80 78 73 85 94 93 71 99 76 88 95 Find the value of the (Spearman's) rank correlation coefficient test statistic that would be used to test the claim of no correlation between midterm score and final exam score. Round your answer...
 PLEASE SHOW ME HOW TO DO THIS....
For
the Excel Data Set please find and report for Test 1 and Test 2 the
Mean, SD, and the tolerance levels for both for which there would
be any outliers (i.e., the value for which a score must be less
than to be consider an outlier and the value for which a number
must greater than to be considered an outlier.
See picture
Performance Data Group 1 1 1 1 Test 2...
PLEASE SHOW ME HOW TO DO THIS....
For
the Excel Data Set please find and report for Test 1 and Test 2 the
Mean, SD, and the tolerance levels for both for which there would
be any outliers (i.e., the value for which a score must be less
than to be consider an outlier and the value for which a number
must greater than to be considered an outlier.
See picture
Performance Data Group 1 1 1 1 Test 2...
Most questions answered within 3 hours.
-
Where is the error in this code sequence?
String s1 = "Hello";
String s2 = "ello";...
asked 10 months ago -
Financial data for Joel de Paris, Inc., for last year
follow:
Joel de Paris, Inc.
Balance...
asked 10 months ago -
Consider this reaction:
Al2(SO4)3 (aq)+ BaCl3
(aq) Al2Cl6 (aq)- +
3BaSO4(s) . What is the...
asked 10 months ago -
Suppose that Savneet is considering increasing her
recent random sample from 20 car rentals to 40...
asked 10 months ago -
Trucks arrive at an unloading terminal at an average rate of 120
per hour.
Trucks arrive...
asked 10 months ago -
Why are methanol and ethanol completely soluble in water while
octanol is not very little soluble....
asked 10 months ago -
A facilities manager at a university reads in a research report
that the mean amount of...
asked 10 months ago -
When the CuSO4 is rehydrated by adding water to the anhydrous
compound, is this an endothermic...
asked 10 months ago -
A ray of sunlight is passing from diamond into crown glass; the
angle of incidence is...
asked 10 months ago -
A block of mass 0.249 kg is placed on top of a light, vertical
spring of...
asked 10 months ago -
how do the kidneys compensate in the presences of acidosis
a) trigger hyperventilate
b) reserve acid...
asked 10 months ago -
Question 501 pts
The rental rate of capital to the firm increases. Which of the
following...
asked 10 months ago