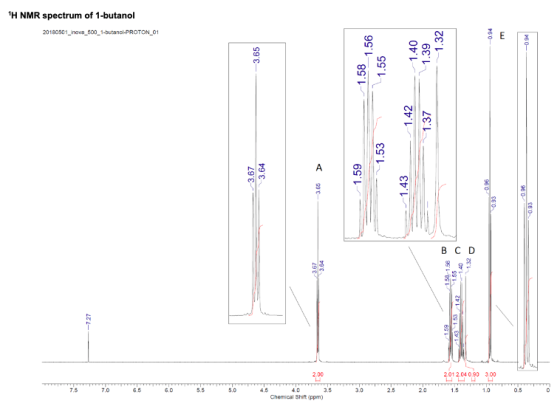
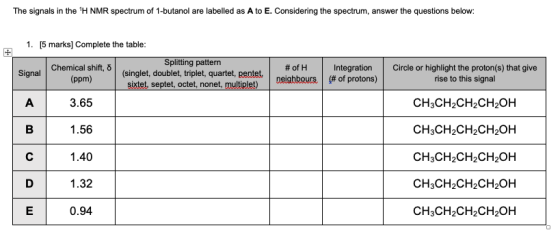
The spectra provided were acquired in CDCl3solvent, which shows a 1H solvent peak from residual CHCl3as a singlet at 7.27 ppm. Please fill in the table
Homework Answers

Add Answer to:
The spectra provided were acquired in CDCl3solvent,
which shows a 1H solvent peak from residual
CHCl3as...
(b)How can you use 1H NMR to distinguish between isopropyl ethanoate and methyl 2-methylpropanoate. 7.27 20180528_Inova_500_isopropyl...
 (b)How can you use 1H NMR to distinguish between
isopropyl ethanoate and methyl 2-methylpropanoate.
7.27 20180528_Inova_500_isopropyl acetate-PROTON_01 5.03 5.02 5.01 66 OL84.974.98 4.96 Chemical Shift (ppm) 4.0 .......... 2.02 .. ...... 6. (a)Complete the table: Signal Chemical shift, 8 (ppm) Splitting pattern (singlet, doublet, triplet, quartet, pentet. sixtet, septet, octet, nonet, multiplet) # of H neighbours Integration (# of protons) Circle or highlight the proton(s) that give rise to this signal H-C-H A 4.99 H-C-H B 2.02 H-C-H C 1.24
(b)How can you use 1H NMR to distinguish between
isopropyl ethanoate and methyl 2-methylpropanoate.
7.27 20180528_Inova_500_isopropyl acetate-PROTON_01 5.03 5.02 5.01 66 OL84.974.98 4.96 Chemical Shift (ppm) 4.0 .......... 2.02 .. ...... 6. (a)Complete the table: Signal Chemical shift, 8 (ppm) Splitting pattern (singlet, doublet, triplet, quartet, pentet. sixtet, septet, octet, nonet, multiplet) # of H neighbours Integration (# of protons) Circle or highlight the proton(s) that give rise to this signal H-C-H A 4.99 H-C-H B 2.02 H-C-H C 1.24
The signals in the 1H NMR spectrum of butanoic acid are labelled from A to D....
The signals in the 1H NMR spectrum of butanoic acid are labelled from A to D. Considering the spectrum, answer the questions below: [4 marks] Complete the table: Signal Chemical shift, δ (ppm) Splitting pattern (singlet, doublet, triplet, quartet, pentet, sixtet, septet, octet, nonet, multiplet) # of H neighbours Integration (# of protons) Circle or highlight the proton(s) that give rise to this signal A 11.60 CH3CH2CH2COOH B 2.35 CH3CH2CH2COOH C 1.68 CH3CH2CH2COOH D 0.98 CH3CH2CH2COOH [2 marks] Compare this...
Given the NMR and IR graphs, which unknown compound fits your graph, and fill out the...
 Given the NMR and IR graphs, which unknown compound fits your
graph, and fill out the tables about your unknown.
STANDARD 1N OBSERVE Archive directory! Sample directory: F1101 PROTON A 14 Pulse Sequence! s2pul Solvent: CDC13 Ambient temperature Mercury-300BB Hvarian300 Relax delay 1.000 sec Puis 45.0 degrees Acg. time 1.996 sec Width 4803.1 MZ & repetitions OBSERVE NL, 233.9587289 MHZ DATA PROCESSING FT size 32768 Total tine min. 25 sec 2.8 0 ppm 0.94 1604 1081 1364 3063 534 1384...
Given the NMR and IR graphs, which unknown compound fits your
graph, and fill out the tables about your unknown.
STANDARD 1N OBSERVE Archive directory! Sample directory: F1101 PROTON A 14 Pulse Sequence! s2pul Solvent: CDC13 Ambient temperature Mercury-300BB Hvarian300 Relax delay 1.000 sec Puis 45.0 degrees Acg. time 1.996 sec Width 4803.1 MZ & repetitions OBSERVE NL, 233.9587289 MHZ DATA PROCESSING FT size 32768 Total tine min. 25 sec 2.8 0 ppm 0.94 1604 1081 1364 3063 534 1384...
Evaluate and investigate the following IR Spectrum, 13C NMR Spectrum and 1H NMR Spectrum. Identify the most important peaks and correlate the results as much as you can from the obtained product in th...
 Evaluate and investigate the
following IR Spectrum, 13C NMR Spectrum
and 1H NMR Spectrum. Identify
the most important peaks and correlate the
results as much as you can from the obtained product in
the multi-step synthesis of ethyl acetoacetate.
This is Product E from this multi-step synthesis
where Product C was identified as in the figure
below and as such, identify what product can be obtained
after the synthesis from the spectra provided. Use the template
below in analysing the...
Evaluate and investigate the
following IR Spectrum, 13C NMR Spectrum
and 1H NMR Spectrum. Identify
the most important peaks and correlate the
results as much as you can from the obtained product in
the multi-step synthesis of ethyl acetoacetate.
This is Product E from this multi-step synthesis
where Product C was identified as in the figure
below and as such, identify what product can be obtained
after the synthesis from the spectra provided. Use the template
below in analysing the...
 (b)How can you use 1H NMR to distinguish between
isopropyl ethanoate and methyl 2-methylpropanoate.
7.27 20180528_Inova_500_isopropyl acetate-PROTON_01 5.03 5.02 5.01 66 OL84.974.98 4.96 Chemical Shift (ppm) 4.0 .......... 2.02 .. ...... 6. (a)Complete the table: Signal Chemical shift, 8 (ppm) Splitting pattern (singlet, doublet, triplet, quartet, pentet. sixtet, septet, octet, nonet, multiplet) # of H neighbours Integration (# of protons) Circle or highlight the proton(s) that give rise to this signal H-C-H A 4.99 H-C-H B 2.02 H-C-H C 1.24
(b)How can you use 1H NMR to distinguish between
isopropyl ethanoate and methyl 2-methylpropanoate.
7.27 20180528_Inova_500_isopropyl acetate-PROTON_01 5.03 5.02 5.01 66 OL84.974.98 4.96 Chemical Shift (ppm) 4.0 .......... 2.02 .. ...... 6. (a)Complete the table: Signal Chemical shift, 8 (ppm) Splitting pattern (singlet, doublet, triplet, quartet, pentet. sixtet, septet, octet, nonet, multiplet) # of H neighbours Integration (# of protons) Circle or highlight the proton(s) that give rise to this signal H-C-H A 4.99 H-C-H B 2.02 H-C-H C 1.24
 Given the NMR and IR graphs, which unknown compound fits your
graph, and fill out the tables about your unknown.
STANDARD 1N OBSERVE Archive directory! Sample directory: F1101 PROTON A 14 Pulse Sequence! s2pul Solvent: CDC13 Ambient temperature Mercury-300BB Hvarian300 Relax delay 1.000 sec Puis 45.0 degrees Acg. time 1.996 sec Width 4803.1 MZ & repetitions OBSERVE NL, 233.9587289 MHZ DATA PROCESSING FT size 32768 Total tine min. 25 sec 2.8 0 ppm 0.94 1604 1081 1364 3063 534 1384...
Given the NMR and IR graphs, which unknown compound fits your
graph, and fill out the tables about your unknown.
STANDARD 1N OBSERVE Archive directory! Sample directory: F1101 PROTON A 14 Pulse Sequence! s2pul Solvent: CDC13 Ambient temperature Mercury-300BB Hvarian300 Relax delay 1.000 sec Puis 45.0 degrees Acg. time 1.996 sec Width 4803.1 MZ & repetitions OBSERVE NL, 233.9587289 MHZ DATA PROCESSING FT size 32768 Total tine min. 25 sec 2.8 0 ppm 0.94 1604 1081 1364 3063 534 1384...
 Evaluate and investigate the
following IR Spectrum, 13C NMR Spectrum
and 1H NMR Spectrum. Identify
the most important peaks and correlate the
results as much as you can from the obtained product in
the multi-step synthesis of ethyl acetoacetate.
This is Product E from this multi-step synthesis
where Product C was identified as in the figure
below and as such, identify what product can be obtained
after the synthesis from the spectra provided. Use the template
below in analysing the...
Evaluate and investigate the
following IR Spectrum, 13C NMR Spectrum
and 1H NMR Spectrum. Identify
the most important peaks and correlate the
results as much as you can from the obtained product in
the multi-step synthesis of ethyl acetoacetate.
This is Product E from this multi-step synthesis
where Product C was identified as in the figure
below and as such, identify what product can be obtained
after the synthesis from the spectra provided. Use the template
below in analysing the...
Most questions answered within 3 hours.
-
Where is the error in this code sequence?
String s1 = "Hello";
String s2 = "ello";...
asked 10 months ago -
Financial data for Joel de Paris, Inc., for last year
follow:
Joel de Paris, Inc.
Balance...
asked 10 months ago -
Consider this reaction:
Al2(SO4)3 (aq)+ BaCl3
(aq) Al2Cl6 (aq)- +
3BaSO4(s) . What is the...
asked 10 months ago -
Suppose that Savneet is considering increasing her
recent random sample from 20 car rentals to 40...
asked 10 months ago -
Trucks arrive at an unloading terminal at an average rate of 120
per hour.
Trucks arrive...
asked 10 months ago -
Why are methanol and ethanol completely soluble in water while
octanol is not very little soluble....
asked 10 months ago -
A facilities manager at a university reads in a research report
that the mean amount of...
asked 10 months ago -
When the CuSO4 is rehydrated by adding water to the anhydrous
compound, is this an endothermic...
asked 10 months ago -
A ray of sunlight is passing from diamond into crown glass; the
angle of incidence is...
asked 10 months ago -
A block of mass 0.249 kg is placed on top of a light, vertical
spring of...
asked 10 months ago -
how do the kidneys compensate in the presences of acidosis
a) trigger hyperventilate
b) reserve acid...
asked 10 months ago -
Question 501 pts
The rental rate of capital to the firm increases. Which of the
following...
asked 10 months ago