
solution and the plot by excel please
Homework Answers
Since the given Frequency Distribution is a Inclusive Type of Class Interval Series; So, we have to Convert it in to Exclusive type of Class Interval Series to make Calculations.
To convert Inclusive type of Class Interval Series as Exclusive; we use the following formulae.


Where LL = Lower Limit
UL = Upper Limit
LB = Lower Boundary
UB = Upper Boundary
d = Differences between the Lower Limit of Present Class Interval and Upper Limit of Previous Class Interval.
Therefore If you Observe the given frequency distribution; d = 1

Therefore to get the Exclusive type of Class Interval Series; we have to Subtract 0.5 from each Lower Limit of the class interval and have to Add 0.5 to each Upper Limit of the Class Interval.
Therefore the Renewed Frequency Distribution is
| C. I | f |
| 14.5 - 19.5 | 9 |
| 19.5 - 24.5 | 14 |
| 24.5 - 29.5 | 33 |
| 29.5 - 34.5 | 30 |
| 34.5 - 39.5 | 14 |
| 39.5 - 44.5 | 8 |
| TOTAL | 108 |
(a) MODE (Z):

Where l = Lower Boundary of Modal Class
f = Frequency of the Modal Class ( Highest Frequency )
f1 = Preceeding frequency of the Modal Class
f2 = Succeeding frequency of the Modal Class
C = Length of class interval of the Modal Class ( i.e find the difference betwween the UB and LB of class interval of the Modal Class )
| C. I | f | |
| 14.5 - 19.5 | 9 | |
| 19.5 - 24.5 | 14  |
|
 24.5
- 29.5 24.5
- 29.5 |
33 
|
MODAL CLASS |
| 29.5 - 34.5 | 30 
|
|
| 34.5 - 39.5 | 14 | |
| 39.5 - 44.5 | 8 |


****************************************************
(b) MEDIAN (M):

Where l = Lower Boundary of the Median Class
f = frequency of the Median Class
m = Cumulative frequency upto the Median Class
C = Class Interval
N/2 = Median Item ( Main Part of the Formula )
Working Rule:
To find the Median; first we want to find the Less than Cumulative Frequenc (LCF). Next we want to find N/2 and have to Search this N/2 in LCF. With that We will Declare the MEDIAN CLASS.
| C. I | f | LCF | |
| 14.5 - 19.5 | 9 | 9 | |
| 19.5 - 24.5 | 14 | 23 m | |
| (l) 24.5 - 29.5 | 33 f | 56 | MEDIAN CLASS |
| 29.5 - 34.5 | 30 | 86 | |
| 34.5 - 39.5 | 14 | 100 | |
| 39.5 - 44.5 | 8 | 108 | |
| TOTAL | 108 | ||
| N | 108 | ||
| N/2 | 54 |


**********************************************************
(c) MEAN and STANDARD DEVIATION:
| C. I | f | x |  |
fxx |
| 14.5 - 19.5 | 9 | 17 | 153 | 2601 |
| 19.5 - 24.5 | 14 | 22 | 308 | 6776 |
| 24.5 - 29.5 | 33 | 27 | 891 | 24057 |
| 29.5 - 34.5 | 30 | 32 | 960 | 30720 |
| 34.5 - 39.5 | 14 | 37 | 518 | 19166 |
| 39.5 - 44.5 | 8 | 42 | 336 | 14112 |
| TOTAL | 108 | 3166 | 97432 | |
| N | 108 | |||
 |
3166 | |||
MEAN 
|
29.3148 | |||
 |
859.3584 | |||
 |
97432 | |||
 |
902.1481 | |||
VARIANCE 
|
42.7898 | |||
S.D 
|
6.5414 |
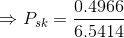
(d) Pearson's Coefficient of Skewness:

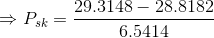

 ;
So, there exist a Postive (Right Skewed ) and the given
distribution is a Positively Skewed Distribution.
;
So, there exist a Postive (Right Skewed ) and the given
distribution is a Positively Skewed Distribution.
(e) Frequency Polygon:
Add Answer to:
solution and the plot by excel please
From the following data, compute the mode, median, Standard...
Calculate the range, mean, mode, median, Standard deviation Calculate the skewness and kurtosis for the above...
Calculate the range, mean, mode, median, Standard deviation Calculate the skewness and kurtosis for the above data and interpret the data. The following is data collected from the daily salary employees of ZZ COMPANY.. 68 19 43 11 37 30 19 67 65 34 96 23 93 73 46 39 21 12 89 52 33 21 18 57 80 56 91 62 56 48 84 23 78 96 49 36 90 42 65 15 43 36 65 59 34 71...
From excel please help me find the mean,median,standard deviation,range,maximum,and minimum.All range from 11.04-224.4 Birth Year -12...
 From excel please help me find the mean,median,standard
deviation,range,maximum,and minimum.All range from
11.04-224.4
Birth Year -12 49 79 25-29 29 13-14 22 24-13 26 23 27 31 32 26 24 31 23 38 28 21 24 35 23 30 34 31 32 23 27 32 39 25 23. 34 ㄾ 30 24 25 27 24 27 29 24 33 29 23 25 74 78 끄 끄 76 76-73·74一75 77芬、76 80 77-74-72 78 76 78 75 77-74 끄 73、72 76 76...
From excel please help me find the mean,median,standard
deviation,range,maximum,and minimum.All range from
11.04-224.4
Birth Year -12 49 79 25-29 29 13-14 22 24-13 26 23 27 31 32 26 24 31 23 38 28 21 24 35 23 30 34 31 32 23 27 32 39 25 23. 34 ㄾ 30 24 25 27 24 27 29 24 33 29 23 25 74 78 끄 끄 76 76-73·74一75 77芬、76 80 77-74-72 78 76 78 75 77-74 끄 73、72 76 76...
These are my instructions: Your data should have been read in from the data file and stored into ...
These are my instructions: Your data should have been read in from the data file and stored into an array. Next you need to calculate the following and display in a single Message box: Average score Highest score Lowest score Mode of the scores Your program should be written using methods and should be well documented internally and externally. Your output should be displayed using Message boxes. This is the .text file to use with the instructions: 20 21 22...
Approximate the measures of center for following GFDT. Data Frequency 30 - 34 2 35 -...
Approximate the measures of center for following GFDT. Data Frequency 30 - 34 2 35 - 39 0 40 - 44 12 45 - 49 16 50 - 54 11 Report mode and median accurate to one decimal place. Report the mean accurate to two decimal places (or enter as a fraction). (a) mode = (b) median = (c) mean =
I need 3b and 3c Cicrise gives you practice putting it all together The following table...
 I need 3b and 3c
Cicrise gives you practice putting it all together The following table shows the age distribution of cases of a certain disease reported during a year in a particular state. Age Number of Cases 5-14 15-24 25-34 35-44 45-54 55-64 10 20 TOTAL 75 3a. Construct a frequency table with columns for class endpoints, class midpoint, frequency, relative frequency, cumulative frequency, and cumulative relative frequency 3b. Construct a cumulative relative frequency plot of the data. Use...
I need 3b and 3c
Cicrise gives you practice putting it all together The following table shows the age distribution of cases of a certain disease reported during a year in a particular state. Age Number of Cases 5-14 15-24 25-34 35-44 45-54 55-64 10 20 TOTAL 75 3a. Construct a frequency table with columns for class endpoints, class midpoint, frequency, relative frequency, cumulative frequency, and cumulative relative frequency 3b. Construct a cumulative relative frequency plot of the data. Use...
Sec 3, Question 3.27 Compute the mean, the median, and the mode for the following data....
 Sec 3, Question 3.27 Compute the mean, the median, and the mode for the following data. Class 0-under 2 2-under 4 4-under 6 6-under 8 8-under 10 10-under 12 12-under 14 *Round your answer to 2 decimal places. Mean = Median = Mode =
1.Construct a frequency distribution for the hybrid cars with a class width of 2. 2.Explain why...
 1.Construct a frequency distribution for the hybrid cars with a
class width of 2.
2.Explain why a class width of 2 is too narrow for these
data.
3.Construct a relative frequency distribution for the hybrid
cars with a class width of 3, where the first class has a lower
limit of 20.
4.Construct a histogram based on this relative frequency
distribution. Is the histogram unimodal or bimodal? Describe the
skewness, if any, in these data.
5.Construct a frequency distribution for...
1.Construct a frequency distribution for the hybrid cars with a
class width of 2.
2.Explain why a class width of 2 is too narrow for these
data.
3.Construct a relative frequency distribution for the hybrid
cars with a class width of 3, where the first class has a lower
limit of 20.
4.Construct a histogram based on this relative frequency
distribution. Is the histogram unimodal or bimodal? Describe the
skewness, if any, in these data.
5.Construct a frequency distribution for...
This Question: 1 pt 24 of 24 (6 complete) This Test: 24 pts The following data...
 This Question: 1 pt 24 of 24 (6 complete) This Test: 24 pts The following data show the ages of recent award-winning male actors at the time when they won their award. Make a frequency table for the data, using bins of 20-29, 30-39, and so on. Click the icon to view the ages of male actors. Complete the table below. Age No. of actors 20-29 30-39 40-49 50-59 60-69 Data Table ODDODD 70-79 33 43 44 31 25 31...
The following data represents the age of 30 lottery winners. 20 31 33 33 34 35...
The following data represents the age of 30 lottery winners. 20 31 33 33 34 35 35 39 41 42 44 47 48 49 52 52 53 53 56 58 59 60 61 61 63 63 63 70 72 86 Complete the frequency distribution for the data. Age Frequency 20-29 30-39 40-49 50-59 60-69 70-79 80-89
Q1) Twenty six smokers were surveyed to ascertain the number of cigarettes each smoked for a 1 we...
 please answer 1 and 2 in detail
Q1) Twenty six smokers were surveyed to ascertain the number of cigarettes each smoked for a 1 weelk period. The results are as follows: 44 39 37 21 31 28 44 29 30 52 40 20 24 32 22 27 50 43 26 37 26 51 34 27 33 25 Create a frequency distribution with 5 classes using the headings: #ofcigarettes. Frequency(), Cumulative Frequency (c), and relative frequency (r). Show details of your...
please answer 1 and 2 in detail
Q1) Twenty six smokers were surveyed to ascertain the number of cigarettes each smoked for a 1 weelk period. The results are as follows: 44 39 37 21 31 28 44 29 30 52 40 20 24 32 22 27 50 43 26 37 26 51 34 27 33 25 Create a frequency distribution with 5 classes using the headings: #ofcigarettes. Frequency(), Cumulative Frequency (c), and relative frequency (r). Show details of your...
 From excel please help me find the mean,median,standard
deviation,range,maximum,and minimum.All range from
11.04-224.4
Birth Year -12 49 79 25-29 29 13-14 22 24-13 26 23 27 31 32 26 24 31 23 38 28 21 24 35 23 30 34 31 32 23 27 32 39 25 23. 34 ㄾ 30 24 25 27 24 27 29 24 33 29 23 25 74 78 끄 끄 76 76-73·74一75 77芬、76 80 77-74-72 78 76 78 75 77-74 끄 73、72 76 76...
From excel please help me find the mean,median,standard
deviation,range,maximum,and minimum.All range from
11.04-224.4
Birth Year -12 49 79 25-29 29 13-14 22 24-13 26 23 27 31 32 26 24 31 23 38 28 21 24 35 23 30 34 31 32 23 27 32 39 25 23. 34 ㄾ 30 24 25 27 24 27 29 24 33 29 23 25 74 78 끄 끄 76 76-73·74一75 77芬、76 80 77-74-72 78 76 78 75 77-74 끄 73、72 76 76...
 I need 3b and 3c
Cicrise gives you practice putting it all together The following table shows the age distribution of cases of a certain disease reported during a year in a particular state. Age Number of Cases 5-14 15-24 25-34 35-44 45-54 55-64 10 20 TOTAL 75 3a. Construct a frequency table with columns for class endpoints, class midpoint, frequency, relative frequency, cumulative frequency, and cumulative relative frequency 3b. Construct a cumulative relative frequency plot of the data. Use...
I need 3b and 3c
Cicrise gives you practice putting it all together The following table shows the age distribution of cases of a certain disease reported during a year in a particular state. Age Number of Cases 5-14 15-24 25-34 35-44 45-54 55-64 10 20 TOTAL 75 3a. Construct a frequency table with columns for class endpoints, class midpoint, frequency, relative frequency, cumulative frequency, and cumulative relative frequency 3b. Construct a cumulative relative frequency plot of the data. Use...
 Sec 3, Question 3.27 Compute the mean, the median, and the mode for the following data. Class 0-under 2 2-under 4 4-under 6 6-under 8 8-under 10 10-under 12 12-under 14 *Round your answer to 2 decimal places. Mean = Median = Mode =
 1.Construct a frequency distribution for the hybrid cars with a
class width of 2.
2.Explain why a class width of 2 is too narrow for these
data.
3.Construct a relative frequency distribution for the hybrid
cars with a class width of 3, where the first class has a lower
limit of 20.
4.Construct a histogram based on this relative frequency
distribution. Is the histogram unimodal or bimodal? Describe the
skewness, if any, in these data.
5.Construct a frequency distribution for...
1.Construct a frequency distribution for the hybrid cars with a
class width of 2.
2.Explain why a class width of 2 is too narrow for these
data.
3.Construct a relative frequency distribution for the hybrid
cars with a class width of 3, where the first class has a lower
limit of 20.
4.Construct a histogram based on this relative frequency
distribution. Is the histogram unimodal or bimodal? Describe the
skewness, if any, in these data.
5.Construct a frequency distribution for...
 This Question: 1 pt 24 of 24 (6 complete) This Test: 24 pts The following data show the ages of recent award-winning male actors at the time when they won their award. Make a frequency table for the data, using bins of 20-29, 30-39, and so on. Click the icon to view the ages of male actors. Complete the table below. Age No. of actors 20-29 30-39 40-49 50-59 60-69 Data Table ODDODD 70-79 33 43 44 31 25 31...
 please answer 1 and 2 in detail
Q1) Twenty six smokers were surveyed to ascertain the number of cigarettes each smoked for a 1 weelk period. The results are as follows: 44 39 37 21 31 28 44 29 30 52 40 20 24 32 22 27 50 43 26 37 26 51 34 27 33 25 Create a frequency distribution with 5 classes using the headings: #ofcigarettes. Frequency(), Cumulative Frequency (c), and relative frequency (r). Show details of your...
please answer 1 and 2 in detail
Q1) Twenty six smokers were surveyed to ascertain the number of cigarettes each smoked for a 1 weelk period. The results are as follows: 44 39 37 21 31 28 44 29 30 52 40 20 24 32 22 27 50 43 26 37 26 51 34 27 33 25 Create a frequency distribution with 5 classes using the headings: #ofcigarettes. Frequency(), Cumulative Frequency (c), and relative frequency (r). Show details of your...
Most questions answered within 3 hours.
-
Where is the error in this code sequence?
String s1 = "Hello";
String s2 = "ello";...
asked 10 months ago -
Financial data for Joel de Paris, Inc., for last year
follow:
Joel de Paris, Inc.
Balance...
asked 10 months ago -
Consider this reaction:
Al2(SO4)3 (aq)+ BaCl3
(aq) Al2Cl6 (aq)- +
3BaSO4(s) . What is the...
asked 10 months ago -
Suppose that Savneet is considering increasing her
recent random sample from 20 car rentals to 40...
asked 10 months ago -
Trucks arrive at an unloading terminal at an average rate of 120
per hour.
Trucks arrive...
asked 10 months ago -
Why are methanol and ethanol completely soluble in water while
octanol is not very little soluble....
asked 10 months ago -
A facilities manager at a university reads in a research report
that the mean amount of...
asked 10 months ago -
When the CuSO4 is rehydrated by adding water to the anhydrous
compound, is this an endothermic...
asked 10 months ago -
A ray of sunlight is passing from diamond into crown glass; the
angle of incidence is...
asked 10 months ago -
A block of mass 0.249 kg is placed on top of a light, vertical
spring of...
asked 10 months ago -
how do the kidneys compensate in the presences of acidosis
a) trigger hyperventilate
b) reserve acid...
asked 10 months ago -
Question 501 pts
The rental rate of capital to the firm increases. Which of the
following...
asked 10 months ago