1)
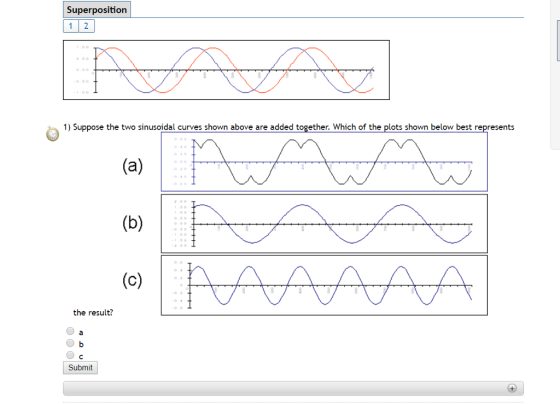
Suppose the two sinusoidal curves shown above are added together. Which of the plots shown below best represents
The due is tomorrow...
Homework Answers

Add Answer to:
1)
Suppose the two sinusoidal curves shown above are added
together. Which of the plots shown...
NONLINEAR (OHMIC) DEVICES 1 Which of the 4 curves above best represents i, vs. Vbe for...
 NONLINEAR (OHMIC) DEVICES 1 Which of the 4 curves above best represents i, vs. Vbe for a BJT ( on the vertical axis)? 2) Which of the 4 curves above best represents i vs. Voe for a BJT (c on the vertical axis)? 3) The small signal transconductance (gm)is equal to the slope of which of the 4 curves above? 4) The impact of base width modulation is visible on which of the 4 curves above? 5) The small signal...
1. The above two plots show a sinusoidal signal and its spectral content respectively. What is...
 1. The above two plots show a sinusoidal signal and its spectral
content respectively. What is the frequency of the sine wave (and
in what units)?
2. What is the largest sampling period (in seconds) that could
be used without aliasing for the signal provided. Explain how you
obtained the answer.
Signal: y-sin(2rft) 0.8 0.6 0.4 ? 0.2 0.2 0.6 0.8 t - [seconds] 25 Spectral Density: IY(fl 20 15 10 Frequency -1?]
1. The above two plots show a sinusoidal signal and its spectral
content respectively. What is the frequency of the sine wave (and
in what units)?
2. What is the largest sampling period (in seconds) that could
be used without aliasing for the signal provided. Explain how you
obtained the answer.
Signal: y-sin(2rft) 0.8 0.6 0.4 ? 0.2 0.2 0.6 0.8 t - [seconds] 25 Spectral Density: IY(fl 20 15 10 Frequency -1?]
Which of the following current functions is a correct representation for the sinusoidal waveform shown below....
 Which of the following current functions is a correct
representation for the sinusoidal waveform shown below. Where,
ω=2π/T.
Question 4 1 pts Which of the following current functions is a correct representation for the sinusoidal waveform shown below. Where, w = 27/T. wt -Im i(t) = Im sin(wt) o i(t) = Im sin(t) o i(t) = Im cos(2twt) oi(t) = Im sin(t) • None of the above
Which of the following current functions is a correct
representation for the sinusoidal waveform shown below. Where,
ω=2π/T.
Question 4 1 pts Which of the following current functions is a correct representation for the sinusoidal waveform shown below. Where, w = 27/T. wt -Im i(t) = Im sin(wt) o i(t) = Im sin(t) o i(t) = Im cos(2twt) oi(t) = Im sin(t) • None of the above
28 (1 Point) Which of the following curves best represents the titration of sodium hydroxide with...
 28 (1 Point) Which of the following curves best represents the titration of sodium hydroxide with hydrochloric acid? PH PH A. Volume HCI added (mL) B. Volume HCI added (mL) PH PH Volume of NaOH added C. D. Volume HCl added (mL)
Shown below are the production possibilities curves for two nations: the United States and Chile. Suppose...
 Shown below are the production possibilities curves for two
nations: the United States and Chile. Suppose these two nations do
not currently engage in international trade or specialization, and
suppose that points A and
a show the combinations of wheat and
copper they now produce and consume.
United States Chile 10 10 2 10 Copper (thousands of pounds) 8 10 Copper (thousands of pounds)
Shown below are the production possibilities curves for two
nations: the United States and Chile. Suppose these two nations do
not currently engage in international trade or specialization, and
suppose that points A and
a show the combinations of wheat and
copper they now produce and consume.
United States Chile 10 10 2 10 Copper (thousands of pounds) 8 10 Copper (thousands of pounds)
Derivation and Plots of Demand, Marginal Revenue, and Revenue Curves Name Due (worth 50 points) The...
 Derivation and Plots of Demand, Marginal Revenue, and Revenue Curves Name Due (worth 50 points) The equation below represents a linear demand curve. Use the grid (right) for your plots. Write all derivations in the space below. 1) Plot the demand function on the top set of axes. Q = 40000-100P, 2) The price function is the inverse of the demand function. Write this inverse below. to 3) Use the price function to obtain the total revenue function (TR). Write...
Suppose that the graph below depicts demand and supply curves for gasoline. Which graph best represents...
 Suppose that the graph below depicts demand and supply curves for gasoline. Which graph best represents the situation when cost producing gasoline (refining) decreases? Figure 2.1 Supply Curve lethard Supply Curve Irightwand Demand Curve tettwardi Demand Curve ingheward) Price Price Price Price / ty (a) Quantity ibi Quantity a Ob Ос Od
Shown below are the production possibilities curves for two nations: the United States and Chile. Suppose...
 Shown below are the production possibilities curves for two nations: the United States and Chile. Suppose these two nations do not currently engage in international trade or specialization, and suppose that points A and a show the combinations of wheat and copper they now produce and consume United States Chile 10 10 10 10 Copper (thousands of pounds) Copper (thousands of pounds) 1. What is the United States opportunity cost for wheat and copper - show your math work? 2....
Suppose you have 2 consumers in the market with the following demand curves: x1=40-2p and x2=...
Suppose you have 2 consumers in the market with the following demand curves: x1=40-2p and x2= 50-1/2P a) Draw the inverse demand curve for these two consumers, on the same graph, with x on the horizontal and p on the vertical axis. Do this on the left hand side of the space below, leaving yourself room to add a second graph on the right. Numerically mark both y-intercepts and x-intercepts. b) Next to the original graph of the individual demand...
1.Which medium above supports the best growth of bacteria? 2. Which of the following will result...
1.Which medium above supports the best growth of bacteria? 2. Which of the following will result when 1% to 5% agar is added to nutrient broth, autoclaved, and cooled? a semi-solid medium a pure culture a liquid medium a mixed culture a solid medium
 NONLINEAR (OHMIC) DEVICES 1 Which of the 4 curves above best represents i, vs. Vbe for a BJT ( on the vertical axis)? 2) Which of the 4 curves above best represents i vs. Voe for a BJT (c on the vertical axis)? 3) The small signal transconductance (gm)is equal to the slope of which of the 4 curves above? 4) The impact of base width modulation is visible on which of the 4 curves above? 5) The small signal...
 1. The above two plots show a sinusoidal signal and its spectral
content respectively. What is the frequency of the sine wave (and
in what units)?
2. What is the largest sampling period (in seconds) that could
be used without aliasing for the signal provided. Explain how you
obtained the answer.
Signal: y-sin(2rft) 0.8 0.6 0.4 ? 0.2 0.2 0.6 0.8 t - [seconds] 25 Spectral Density: IY(fl 20 15 10 Frequency -1?]
1. The above two plots show a sinusoidal signal and its spectral
content respectively. What is the frequency of the sine wave (and
in what units)?
2. What is the largest sampling period (in seconds) that could
be used without aliasing for the signal provided. Explain how you
obtained the answer.
Signal: y-sin(2rft) 0.8 0.6 0.4 ? 0.2 0.2 0.6 0.8 t - [seconds] 25 Spectral Density: IY(fl 20 15 10 Frequency -1?]
 Which of the following current functions is a correct
representation for the sinusoidal waveform shown below. Where,
ω=2π/T.
Question 4 1 pts Which of the following current functions is a correct representation for the sinusoidal waveform shown below. Where, w = 27/T. wt -Im i(t) = Im sin(wt) o i(t) = Im sin(t) o i(t) = Im cos(2twt) oi(t) = Im sin(t) • None of the above
Which of the following current functions is a correct
representation for the sinusoidal waveform shown below. Where,
ω=2π/T.
Question 4 1 pts Which of the following current functions is a correct representation for the sinusoidal waveform shown below. Where, w = 27/T. wt -Im i(t) = Im sin(wt) o i(t) = Im sin(t) o i(t) = Im cos(2twt) oi(t) = Im sin(t) • None of the above
 28 (1 Point) Which of the following curves best represents the titration of sodium hydroxide with hydrochloric acid? PH PH A. Volume HCI added (mL) B. Volume HCI added (mL) PH PH Volume of NaOH added C. D. Volume HCl added (mL)
 Shown below are the production possibilities curves for two
nations: the United States and Chile. Suppose these two nations do
not currently engage in international trade or specialization, and
suppose that points A and
a show the combinations of wheat and
copper they now produce and consume.
United States Chile 10 10 2 10 Copper (thousands of pounds) 8 10 Copper (thousands of pounds)
Shown below are the production possibilities curves for two
nations: the United States and Chile. Suppose these two nations do
not currently engage in international trade or specialization, and
suppose that points A and
a show the combinations of wheat and
copper they now produce and consume.
United States Chile 10 10 2 10 Copper (thousands of pounds) 8 10 Copper (thousands of pounds)
 Derivation and Plots of Demand, Marginal Revenue, and Revenue Curves Name Due (worth 50 points) The equation below represents a linear demand curve. Use the grid (right) for your plots. Write all derivations in the space below. 1) Plot the demand function on the top set of axes. Q = 40000-100P, 2) The price function is the inverse of the demand function. Write this inverse below. to 3) Use the price function to obtain the total revenue function (TR). Write...
 Suppose that the graph below depicts demand and supply curves for gasoline. Which graph best represents the situation when cost producing gasoline (refining) decreases? Figure 2.1 Supply Curve lethard Supply Curve Irightwand Demand Curve tettwardi Demand Curve ingheward) Price Price Price Price / ty (a) Quantity ibi Quantity a Ob Ос Od
 Shown below are the production possibilities curves for two nations: the United States and Chile. Suppose these two nations do not currently engage in international trade or specialization, and suppose that points A and a show the combinations of wheat and copper they now produce and consume United States Chile 10 10 10 10 Copper (thousands of pounds) Copper (thousands of pounds) 1. What is the United States opportunity cost for wheat and copper - show your math work? 2....
Most questions answered within 3 hours.
-
Where is the error in this code sequence?
String s1 = "Hello";
String s2 = "ello";...
asked 10 months ago -
Financial data for Joel de Paris, Inc., for last year
follow:
Joel de Paris, Inc.
Balance...
asked 10 months ago -
Consider this reaction:
Al2(SO4)3 (aq)+ BaCl3
(aq) Al2Cl6 (aq)- +
3BaSO4(s) . What is the...
asked 10 months ago -
Suppose that Savneet is considering increasing her
recent random sample from 20 car rentals to 40...
asked 10 months ago -
Trucks arrive at an unloading terminal at an average rate of 120
per hour.
Trucks arrive...
asked 10 months ago -
Why are methanol and ethanol completely soluble in water while
octanol is not very little soluble....
asked 10 months ago -
A facilities manager at a university reads in a research report
that the mean amount of...
asked 10 months ago -
When the CuSO4 is rehydrated by adding water to the anhydrous
compound, is this an endothermic...
asked 10 months ago -
A ray of sunlight is passing from diamond into crown glass; the
angle of incidence is...
asked 10 months ago -
A block of mass 0.249 kg is placed on top of a light, vertical
spring of...
asked 10 months ago -
how do the kidneys compensate in the presences of acidosis
a) trigger hyperventilate
b) reserve acid...
asked 10 months ago -
Question 501 pts
The rental rate of capital to the firm increases. Which of the
following...
asked 10 months ago