

Homework Answers


Add Answer to:
Part 1: Exponential Fourier series The following MATLAB code calculates the exponential Fourier series coefficient for...
f) Calculate the coefficients of the trigonometric form of the Fourier series numerically in MATLAB and...
 f) Calculate the coefficients of the trigonometric form of the Fourier series
numerically in MATLAB and graphically represent the one-sided spectrum
(width and phase) frequency for n up to 10 compared to the analytics results.
g) From the coefficients of the trigonometric form of the Fourier series ,
calculate the coefficients of the exposure series and present the two-sided spectrum (width and phase) frequency.
h) Find the average and active value of the signal from the Fourier expansion.
i) Check...
f) Calculate the coefficients of the trigonometric form of the Fourier series
numerically in MATLAB and graphically represent the one-sided spectrum
(width and phase) frequency for n up to 10 compared to the analytics results.
g) From the coefficients of the trigonometric form of the Fourier series ,
calculate the coefficients of the exposure series and present the two-sided spectrum (width and phase) frequency.
h) Find the average and active value of the signal from the Fourier expansion.
i) Check...
Q1) For the periodic signals x() and ) shown below: x(t) YCO y(t) a) Find the exponential Fourier...
 Q1) For the periodic signals x() and ) shown below: x(t) YCO y(t) a) Find the exponential Fourier series for x(t) and y). b) Sketch the amplitude and phase spectra for signal x(). c) Use Parseval's theorem to approximate the power of the periodic signal x() by calculating the power of the first N harmonics, such that the strength of the Nth harmonic is 10% or more of the power of the DC component.
Q1) For the periodic signals x()...
Q1) For the periodic signals x() and ) shown below: x(t) YCO y(t) a) Find the exponential Fourier series for x(t) and y). b) Sketch the amplitude and phase spectra for signal x(). c) Use Parseval's theorem to approximate the power of the periodic signal x() by calculating the power of the first N harmonics, such that the strength of the Nth harmonic is 10% or more of the power of the DC component.
Q1) For the periodic signals x()...
PLZ shows you Matlab Code X(t) 2 2 46 1. compute the Fourier Series coefficients, ck...
 PLZ shows you Matlab Code
X(t) 2 2 46 1. compute the Fourier Series coefficients, ck for the signal x(t) 2. plot magnitude of c and the phase of ck in separate plots (use subplot command) plot the Fourier Series coefficients for the square wave signal: ck(12/9) sinc(2"k/3)
PLZ shows you Matlab Code
X(t) 2 2 46 1. compute the Fourier Series coefficients, ck for the signal x(t) 2. plot magnitude of c and the phase of ck in separate plots (use subplot command) plot the Fourier Series coefficients for the square wave signal: ck(12/9) sinc(2"k/3)
signal and systems 3.11. For each of the following signals, compute the complex exponential Fourier series...
 signal and systems
3.11. For each of the following signals, compute the complex exponential Fourier series by using trigonometric identities, and then sketch the amplitude and phase spectra for all values of k , (a) x(t) = cos(51-7r/4) (b) x(1) sin! + cos[
signal and systems
3.11. For each of the following signals, compute the complex exponential Fourier series by using trigonometric identities, and then sketch the amplitude and phase spectra for all values of k , (a) x(t) = cos(51-7r/4) (b) x(1) sin! + cos[
Please send the Matlab code 2. Compute the Fourier series coefficients for x(t) using MATLAB and...
 Please send the Matlab code
2. Compute the Fourier series coefficients for x(t) using MATLAB and plot the double-sided spectra up to the 10th harmonic. (20 points) 수 x(t) -10 10 20 30
Please send the Matlab code
2. Compute the Fourier series coefficients for x(t) using MATLAB and plot the double-sided spectra up to the 10th harmonic. (20 points) 수 x(t) -10 10 20 30
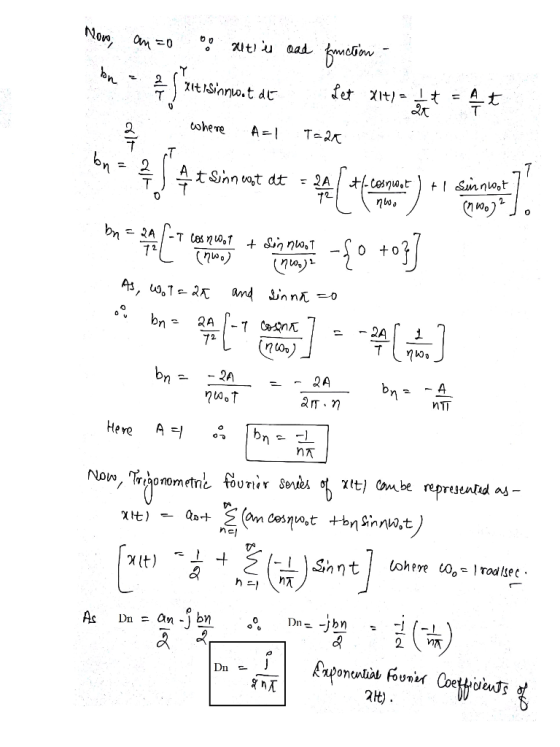
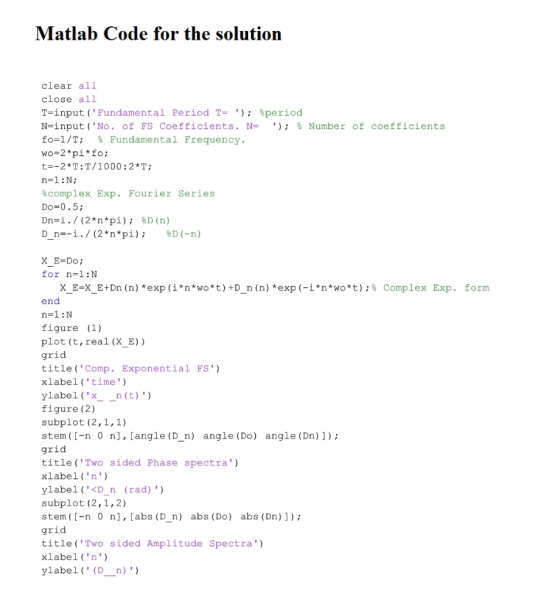
Problem 2: For the signal g(t) t, a) (25 points) Find the exponential Fourier series to...
 Problem 2: For the signal g(t) t, a) (25 points) Find the exponential Fourier series to represent g(t) over the interval (-π, π). Sketch the spectra (amplitude and phase of Fourier series coefficients). b) (25 points) Find the average power of g(t) within interval (- ,r). Using this result and given that Σ00.-6, verify the Parseval's theorem
Problem 6: I7 Points For the following periodic signal, x(t) 4OSesi a) Express the signal exponent +cos(9t) +2cos(15t) al in complex exponential Fourier series form. 13 r series coefficients and...
 Problem 6: I7 Points For the following periodic signal, x(t) 4OSesi a) Express the signal exponent +cos(9t) +2cos(15t) al in complex exponential Fourier series form. 13 r series coefficients and sketch the spectral line. [2 Find the fundamental frequency and identilY the harmonics in the signal. 12) Solution
Problem 6: I7 Points For the following periodic signal, x(t) 4OSesi a) Express the signal exponent +cos(9t) +2cos(15t) al in complex exponential Fourier series form. 13 r series coefficients and sketch the...
Problem 6: I7 Points For the following periodic signal, x(t) 4OSesi a) Express the signal exponent +cos(9t) +2cos(15t) al in complex exponential Fourier series form. 13 r series coefficients and sketch the spectral line. [2 Find the fundamental frequency and identilY the harmonics in the signal. 12) Solution
Problem 6: I7 Points For the following periodic signal, x(t) 4OSesi a) Express the signal exponent +cos(9t) +2cos(15t) al in complex exponential Fourier series form. 13 r series coefficients and sketch the...
3.11-For each of the following signals compute the complex exponential Fourier series by using tr...
 3.11-For each of the following signals compute the complex exponential Fourier series by using trigonometric identities,and then sketch the amplitude and phase spectra for all values of k (a) x(t)-cos(5t-π/4) (b) x(t) sint+ cos t 756 Chapter & The Series and fourier Translorm 023 4 5 ibi FIGURE Pa P33 3.13 Problems 157 in 0 14 12 3 I) ain FIGURE ,3.3 (antísndj (c) sti)-cos(1-1) + sin(,-%) 3.12. Determine the exponential Fourier series tor the Following periodic signals
3.11-For each...
3.11-For each of the following signals compute the complex exponential Fourier series by using trigonometric identities,and then sketch the amplitude and phase spectra for all values of k (a) x(t)-cos(5t-π/4) (b) x(t) sint+ cos t 756 Chapter & The Series and fourier Translorm 023 4 5 ibi FIGURE Pa P33 3.13 Problems 157 in 0 14 12 3 I) ain FIGURE ,3.3 (antísndj (c) sti)-cos(1-1) + sin(,-%) 3.12. Determine the exponential Fourier series tor the Following periodic signals
3.11-For each...
3) Find the exponential Fourier series for the periodic signal x(t)= e 1/2 over the range...
 3) Find the exponential Fourier series for the periodic signal x(t)= e 1/2 over the range 0..1, periodically continued. 4) Plot the amplitude and phase spectra of this signal. How do they compare to (2) above?
A periodic signal, x(t) is shown below. A = 10, T-4 sec. -T Write a MATLAB script to plot the sig...
 A periodic signal, x(t) is shown below. A = 10, T-4 sec. -T Write a MATLAB script to plot the signal, using enough points to get a smooth curve. Compute the Fourier series coefficients for the signal (if you can find them in the text, that is ok). Plot the single-sided or double-sided spectra for each signal. Include enough frequencies in the plots to adequately represent the frequency content of the signals. Plot partial sums of the Fourier series for...
 f) Calculate the coefficients of the trigonometric form of the Fourier series
numerically in MATLAB and graphically represent the one-sided spectrum
(width and phase) frequency for n up to 10 compared to the analytics results.
g) From the coefficients of the trigonometric form of the Fourier series ,
calculate the coefficients of the exposure series and present the two-sided spectrum (width and phase) frequency.
h) Find the average and active value of the signal from the Fourier expansion.
i) Check...
f) Calculate the coefficients of the trigonometric form of the Fourier series
numerically in MATLAB and graphically represent the one-sided spectrum
(width and phase) frequency for n up to 10 compared to the analytics results.
g) From the coefficients of the trigonometric form of the Fourier series ,
calculate the coefficients of the exposure series and present the two-sided spectrum (width and phase) frequency.
h) Find the average and active value of the signal from the Fourier expansion.
i) Check...
 Q1) For the periodic signals x() and ) shown below: x(t) YCO y(t) a) Find the exponential Fourier series for x(t) and y). b) Sketch the amplitude and phase spectra for signal x(). c) Use Parseval's theorem to approximate the power of the periodic signal x() by calculating the power of the first N harmonics, such that the strength of the Nth harmonic is 10% or more of the power of the DC component.
Q1) For the periodic signals x()...
Q1) For the periodic signals x() and ) shown below: x(t) YCO y(t) a) Find the exponential Fourier series for x(t) and y). b) Sketch the amplitude and phase spectra for signal x(). c) Use Parseval's theorem to approximate the power of the periodic signal x() by calculating the power of the first N harmonics, such that the strength of the Nth harmonic is 10% or more of the power of the DC component.
Q1) For the periodic signals x()...
 PLZ shows you Matlab Code
X(t) 2 2 46 1. compute the Fourier Series coefficients, ck for the signal x(t) 2. plot magnitude of c and the phase of ck in separate plots (use subplot command) plot the Fourier Series coefficients for the square wave signal: ck(12/9) sinc(2"k/3)
PLZ shows you Matlab Code
X(t) 2 2 46 1. compute the Fourier Series coefficients, ck for the signal x(t) 2. plot magnitude of c and the phase of ck in separate plots (use subplot command) plot the Fourier Series coefficients for the square wave signal: ck(12/9) sinc(2"k/3)
 signal and systems
3.11. For each of the following signals, compute the complex exponential Fourier series by using trigonometric identities, and then sketch the amplitude and phase spectra for all values of k , (a) x(t) = cos(51-7r/4) (b) x(1) sin! + cos[
signal and systems
3.11. For each of the following signals, compute the complex exponential Fourier series by using trigonometric identities, and then sketch the amplitude and phase spectra for all values of k , (a) x(t) = cos(51-7r/4) (b) x(1) sin! + cos[
 Please send the Matlab code
2. Compute the Fourier series coefficients for x(t) using MATLAB and plot the double-sided spectra up to the 10th harmonic. (20 points) 수 x(t) -10 10 20 30
Please send the Matlab code
2. Compute the Fourier series coefficients for x(t) using MATLAB and plot the double-sided spectra up to the 10th harmonic. (20 points) 수 x(t) -10 10 20 30
 Problem 2: For the signal g(t) t, a) (25 points) Find the exponential Fourier series to represent g(t) over the interval (-π, π). Sketch the spectra (amplitude and phase of Fourier series coefficients). b) (25 points) Find the average power of g(t) within interval (- ,r). Using this result and given that Σ00.-6, verify the Parseval's theorem
 Problem 6: I7 Points For the following periodic signal, x(t) 4OSesi a) Express the signal exponent +cos(9t) +2cos(15t) al in complex exponential Fourier series form. 13 r series coefficients and sketch the spectral line. [2 Find the fundamental frequency and identilY the harmonics in the signal. 12) Solution
Problem 6: I7 Points For the following periodic signal, x(t) 4OSesi a) Express the signal exponent +cos(9t) +2cos(15t) al in complex exponential Fourier series form. 13 r series coefficients and sketch the...
Problem 6: I7 Points For the following periodic signal, x(t) 4OSesi a) Express the signal exponent +cos(9t) +2cos(15t) al in complex exponential Fourier series form. 13 r series coefficients and sketch the spectral line. [2 Find the fundamental frequency and identilY the harmonics in the signal. 12) Solution
Problem 6: I7 Points For the following periodic signal, x(t) 4OSesi a) Express the signal exponent +cos(9t) +2cos(15t) al in complex exponential Fourier series form. 13 r series coefficients and sketch the...
 3.11-For each of the following signals compute the complex exponential Fourier series by using trigonometric identities,and then sketch the amplitude and phase spectra for all values of k (a) x(t)-cos(5t-π/4) (b) x(t) sint+ cos t 756 Chapter & The Series and fourier Translorm 023 4 5 ibi FIGURE Pa P33 3.13 Problems 157 in 0 14 12 3 I) ain FIGURE ,3.3 (antísndj (c) sti)-cos(1-1) + sin(,-%) 3.12. Determine the exponential Fourier series tor the Following periodic signals
3.11-For each...
3.11-For each of the following signals compute the complex exponential Fourier series by using trigonometric identities,and then sketch the amplitude and phase spectra for all values of k (a) x(t)-cos(5t-π/4) (b) x(t) sint+ cos t 756 Chapter & The Series and fourier Translorm 023 4 5 ibi FIGURE Pa P33 3.13 Problems 157 in 0 14 12 3 I) ain FIGURE ,3.3 (antísndj (c) sti)-cos(1-1) + sin(,-%) 3.12. Determine the exponential Fourier series tor the Following periodic signals
3.11-For each...
 3) Find the exponential Fourier series for the periodic signal x(t)= e 1/2 over the range 0..1, periodically continued. 4) Plot the amplitude and phase spectra of this signal. How do they compare to (2) above?
 A periodic signal, x(t) is shown below. A = 10, T-4 sec. -T Write a MATLAB script to plot the signal, using enough points to get a smooth curve. Compute the Fourier series coefficients for the signal (if you can find them in the text, that is ok). Plot the single-sided or double-sided spectra for each signal. Include enough frequencies in the plots to adequately represent the frequency content of the signals. Plot partial sums of the Fourier series for...
Most questions answered within 3 hours.
-
Where is the error in this code sequence?
String s1 = "Hello";
String s2 = "ello";...
asked 11 months ago -
Financial data for Joel de Paris, Inc., for last year
follow:
Joel de Paris, Inc.
Balance...
asked 11 months ago -
Consider this reaction:
Al2(SO4)3 (aq)+ BaCl3
(aq) Al2Cl6 (aq)- +
3BaSO4(s) . What is the...
asked 11 months ago -
Suppose that Savneet is considering increasing her
recent random sample from 20 car rentals to 40...
asked 11 months ago -
Trucks arrive at an unloading terminal at an average rate of 120
per hour.
Trucks arrive...
asked 11 months ago -
Why are methanol and ethanol completely soluble in water while
octanol is not very little soluble....
asked 11 months ago -
A facilities manager at a university reads in a research report
that the mean amount of...
asked 11 months ago -
When the CuSO4 is rehydrated by adding water to the anhydrous
compound, is this an endothermic...
asked 11 months ago -
A ray of sunlight is passing from diamond into crown glass; the
angle of incidence is...
asked 11 months ago -
A block of mass 0.249 kg is placed on top of a light, vertical
spring of...
asked 11 months ago -
how do the kidneys compensate in the presences of acidosis
a) trigger hyperventilate
b) reserve acid...
asked 11 months ago -
Question 501 pts
The rental rate of capital to the firm increases. Which of the
following...
asked 11 months ago