
Homework Answers
MATLAB code is given below in bold letters.
clc;
close all;
clear all;
% define the signal parameters
A = 10;
T = 4;
w0 = 2*pi/T;
% define the symbolic variables
syms n t;
% define the signal
f = -A/T*t+A;
% evaluate the fourier series integral
an1 = 2/T*int(f*cos(n*w0*t),0,T);
bn1 = 2/T*int(f*sin(n*w0*t),0,T);
a0 = 1/T*int(f,0,T);
% obtain C by substituting n in c[n]
nmax = 100;
n = 1:nmax;
a = subs(an1);
b = subs(bn1);
% define the time vector
ts = 1e-1; % ts is sampling the
t = 0:ts:4*T-ts;
% directly plot the signal x(t)
t1 = 0:ts:4-ts;
x1 = -A/T*t1+A;
x = repmat(x1,1,4);
figure;
plot(t,x,'r','linewidth',2);grid on;
xlabel('time');ylabel('x(t)');
ylim([-5 15]);
% Now fourier series reconstruction
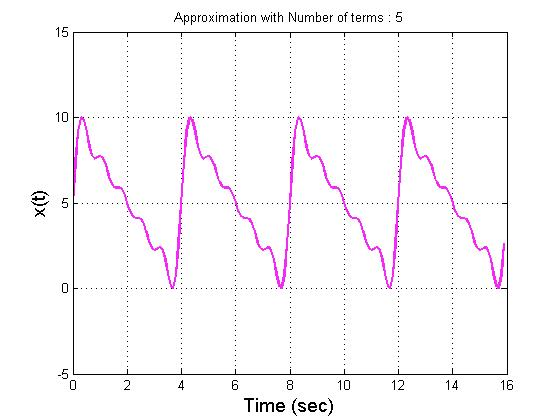
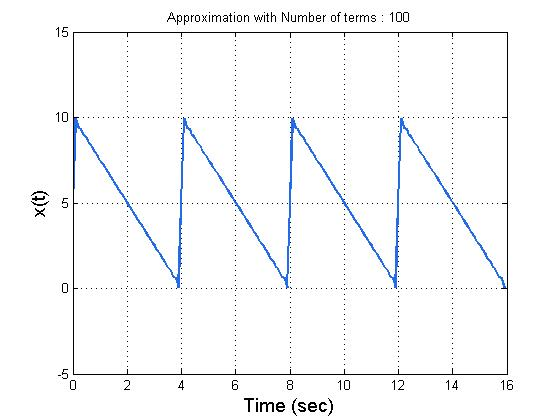
N = [5 50 100];
for p = 1:length(N)
for i = 1:length(t)
for k = 1:N(p)
x(k,i) = a(k)*cos(k*w0*t(i)) + b(k)*sin(k*w0*t(i));
end
y(i) = a0+sum(x(:,i)); % Add DC term
end
figure;
plot(t,y,'color',rand(1,3),'linewidth',2); % Plot results
xlabel('Time (sec)','FontSize',14); grid on;
ylabel('x(t)','FontSize',14);ylim([-5 15]);
STRING = ['Approximation with Number of terms :
',num2str(N(p))];
title(STRING);
end


Add Answer to:
A periodic signal, x(t) is shown below. A = 10, T-4 sec. -T Write a MATLAB script to plot the sig...
Problem 2: A periodic signalxit) is shown below A =10, T-4 sec. -T Write a MATLAB script to plot ...
 Problem 2: A periodic signalxit) is shown below A =10, T-4 sec. -T Write a MATLAB script to plot the signal, using enough points to get a smooth curve. Compute the Fourier series coefficients for the signal (if you can find them in the text, that is ok). Plot the single-sided or double-sided spectra for each signal. Include enough frequencies in the plots to adequately represent the frequency content of the signals. Plot partial sums of the Fourier series for...
Use MATLAB to : ("j" is the imaginary number.) The term lo is the fundamental frequency...
 Use MATLAB to :
("j" is the imaginary number.) The term lo is the fundamental frequency of the periodic signal, 2/T, where T is the period. Frequencies nlo, where n is an integer, are the harmonics. This infinite sum is an exact representation of the original function. If we use a finite sum, where n goes from -N to N, we will get an approximation "X-(t)". In this problem we will calculate and plot the Fourier series representation of a...
Use MATLAB to :
("j" is the imaginary number.) The term lo is the fundamental frequency of the periodic signal, 2/T, where T is the period. Frequencies nlo, where n is an integer, are the harmonics. This infinite sum is an exact representation of the original function. If we use a finite sum, where n goes from -N to N, we will get an approximation "X-(t)". In this problem we will calculate and plot the Fourier series representation of a...
Please send the Matlab code 2. Compute the Fourier series coefficients for x(t) using MATLAB and...
 Please send the Matlab code
2. Compute the Fourier series coefficients for x(t) using MATLAB and plot the double-sided spectra up to the 10th harmonic. (20 points) 수 x(t) -10 10 20 30
Please send the Matlab code
2. Compute the Fourier series coefficients for x(t) using MATLAB and plot the double-sided spectra up to the 10th harmonic. (20 points) 수 x(t) -10 10 20 30
PLZ shows you Matlab Code X(t) 2 2 46 1. compute the Fourier Series coefficients, ck...
 PLZ shows you Matlab Code
X(t) 2 2 46 1. compute the Fourier Series coefficients, ck for the signal x(t) 2. plot magnitude of c and the phase of ck in separate plots (use subplot command) plot the Fourier Series coefficients for the square wave signal: ck(12/9) sinc(2"k/3)
PLZ shows you Matlab Code
X(t) 2 2 46 1. compute the Fourier Series coefficients, ck for the signal x(t) 2. plot magnitude of c and the phase of ck in separate plots (use subplot command) plot the Fourier Series coefficients for the square wave signal: ck(12/9) sinc(2"k/3)
Part 1: Exponential Fourier series The following MATLAB code calculates the exponential Fourier series coefficient for...
 Part 1: Exponential Fourier series The following MATLAB code calculates the exponential Fourier series coefficient for the signal x(t) shown in the figure below, plots it's double sided amplitude spectrum IDn l, double sided phase spectrem LDn, and the resulting signal xn(t). 4r 4a Periodic signal x(t) 1.1 Show that the complex Fourier Series Coefficients written as: D 1.2 Use the following Matlab to general the two sided spectral line. 1.3 Execute the Matlab code with To = 2π and...
Q1) For the periodic signals x() and ) shown below: x(t) YCO y(t) a) Find the exponential Fourier...
 Q1) For the periodic signals x() and ) shown below: x(t) YCO y(t) a) Find the exponential Fourier series for x(t) and y). b) Sketch the amplitude and phase spectra for signal x(). c) Use Parseval's theorem to approximate the power of the periodic signal x() by calculating the power of the first N harmonics, such that the strength of the Nth harmonic is 10% or more of the power of the DC component.
Q1) For the periodic signals x()...
Q1) For the periodic signals x() and ) shown below: x(t) YCO y(t) a) Find the exponential Fourier series for x(t) and y). b) Sketch the amplitude and phase spectra for signal x(). c) Use Parseval's theorem to approximate the power of the periodic signal x() by calculating the power of the first N harmonics, such that the strength of the Nth harmonic is 10% or more of the power of the DC component.
Q1) For the periodic signals x()...
During lab 4, we have seen numerical implementation of Fourier Series for periodic signals. As first part of this assignment, you need to write a Matlab function that would take an array representing...
During lab 4, we have seen numerical implementation of Fourier Series for periodic signals. As first part of this assignment, you need to write a Matlab function that would take an array representing a single period of a signal (x), corresponding time array (t), and return the Fourier Series coefficients (Ck) in exponential form. The function should also be able to take two (2) optional input arguments: number of Fourier coefficients (Nk) and plot option (p). Use the template ‘fourier_series_exp.m’...
1. We have a signal, x (t), with period of T - 2 second with the signal in one period given below: x(t)- ^x,(t+nT) wher...
 1. We have a signal, x (t), with period of T - 2 second with the signal in one period given below: x(t)- ^x,(t+nT) wherex,) 1-2 (t - ) Kt<1 n=-oo 0 1/2 (a) Find the Fourier series coefficients for this signal. That is, find the values of ak so that x (t) Hint: te-jwt teJwt dt (b) Write some MATLAB code which will plot the signal resulting from a truncated Fourier Series using the coefficients you calculated in part...
Let a periodic signal x(t) with a fundamental frequency ??e2? have a period 4.6 (a) Plot...
Let a periodic signal x(t) with a fundamental frequency ??e2? have a period 4.6 (a) Plot x(t), and indicate its fundamental period To (b) Compute the Fourier series coefficients of x(t) using their integral (c) (d) Answers: x(t) is periodic of fundamental period definition. Use the Laplace transform to compute the Fourier series coefficients Xk. Indicate how to compute the dc term. Suppose that y(t) = dx(t)/dt, find the Fourier transform of x(t) by means of the Fourier series coefficients...
2.For the periodic DT signal shown in Top, a) determine the Fourier Series Coefficients. b) Use...
 2.For the periodic DT signal shown in Top, a) determine the
Fourier Series Coefficients. b) Use MATLAB to generate a spectral
plot (magnitude plot and a separate phase plot). c) Use MATLAB to
generate and plot the signal as a DTFS expansion of the periodic
signal. Plot over an interval containing several periods. Make sure
to include the MATLAB code
x[ri] -9 63 3 9 12 n 1. For the periodic DT signal shown in Top, a) determine the Fourier...
2.For the periodic DT signal shown in Top, a) determine the
Fourier Series Coefficients. b) Use MATLAB to generate a spectral
plot (magnitude plot and a separate phase plot). c) Use MATLAB to
generate and plot the signal as a DTFS expansion of the periodic
signal. Plot over an interval containing several periods. Make sure
to include the MATLAB code
x[ri] -9 63 3 9 12 n 1. For the periodic DT signal shown in Top, a) determine the Fourier...
 Problem 2: A periodic signalxit) is shown below A =10, T-4 sec. -T Write a MATLAB script to plot the signal, using enough points to get a smooth curve. Compute the Fourier series coefficients for the signal (if you can find them in the text, that is ok). Plot the single-sided or double-sided spectra for each signal. Include enough frequencies in the plots to adequately represent the frequency content of the signals. Plot partial sums of the Fourier series for...
 Use MATLAB to :
("j" is the imaginary number.) The term lo is the fundamental frequency of the periodic signal, 2/T, where T is the period. Frequencies nlo, where n is an integer, are the harmonics. This infinite sum is an exact representation of the original function. If we use a finite sum, where n goes from -N to N, we will get an approximation "X-(t)". In this problem we will calculate and plot the Fourier series representation of a...
Use MATLAB to :
("j" is the imaginary number.) The term lo is the fundamental frequency of the periodic signal, 2/T, where T is the period. Frequencies nlo, where n is an integer, are the harmonics. This infinite sum is an exact representation of the original function. If we use a finite sum, where n goes from -N to N, we will get an approximation "X-(t)". In this problem we will calculate and plot the Fourier series representation of a...
 Please send the Matlab code
2. Compute the Fourier series coefficients for x(t) using MATLAB and plot the double-sided spectra up to the 10th harmonic. (20 points) 수 x(t) -10 10 20 30
Please send the Matlab code
2. Compute the Fourier series coefficients for x(t) using MATLAB and plot the double-sided spectra up to the 10th harmonic. (20 points) 수 x(t) -10 10 20 30
 PLZ shows you Matlab Code
X(t) 2 2 46 1. compute the Fourier Series coefficients, ck for the signal x(t) 2. plot magnitude of c and the phase of ck in separate plots (use subplot command) plot the Fourier Series coefficients for the square wave signal: ck(12/9) sinc(2"k/3)
PLZ shows you Matlab Code
X(t) 2 2 46 1. compute the Fourier Series coefficients, ck for the signal x(t) 2. plot magnitude of c and the phase of ck in separate plots (use subplot command) plot the Fourier Series coefficients for the square wave signal: ck(12/9) sinc(2"k/3)
 Part 1: Exponential Fourier series The following MATLAB code calculates the exponential Fourier series coefficient for the signal x(t) shown in the figure below, plots it's double sided amplitude spectrum IDn l, double sided phase spectrem LDn, and the resulting signal xn(t). 4r 4a Periodic signal x(t) 1.1 Show that the complex Fourier Series Coefficients written as: D 1.2 Use the following Matlab to general the two sided spectral line. 1.3 Execute the Matlab code with To = 2π and...
 Q1) For the periodic signals x() and ) shown below: x(t) YCO y(t) a) Find the exponential Fourier series for x(t) and y). b) Sketch the amplitude and phase spectra for signal x(). c) Use Parseval's theorem to approximate the power of the periodic signal x() by calculating the power of the first N harmonics, such that the strength of the Nth harmonic is 10% or more of the power of the DC component.
Q1) For the periodic signals x()...
Q1) For the periodic signals x() and ) shown below: x(t) YCO y(t) a) Find the exponential Fourier series for x(t) and y). b) Sketch the amplitude and phase spectra for signal x(). c) Use Parseval's theorem to approximate the power of the periodic signal x() by calculating the power of the first N harmonics, such that the strength of the Nth harmonic is 10% or more of the power of the DC component.
Q1) For the periodic signals x()...
 1. We have a signal, x (t), with period of T - 2 second with the signal in one period given below: x(t)- ^x,(t+nT) wherex,) 1-2 (t - ) Kt<1 n=-oo 0 1/2 (a) Find the Fourier series coefficients for this signal. That is, find the values of ak so that x (t) Hint: te-jwt teJwt dt (b) Write some MATLAB code which will plot the signal resulting from a truncated Fourier Series using the coefficients you calculated in part...
 2.For the periodic DT signal shown in Top, a) determine the
Fourier Series Coefficients. b) Use MATLAB to generate a spectral
plot (magnitude plot and a separate phase plot). c) Use MATLAB to
generate and plot the signal as a DTFS expansion of the periodic
signal. Plot over an interval containing several periods. Make sure
to include the MATLAB code
x[ri] -9 63 3 9 12 n 1. For the periodic DT signal shown in Top, a) determine the Fourier...
2.For the periodic DT signal shown in Top, a) determine the
Fourier Series Coefficients. b) Use MATLAB to generate a spectral
plot (magnitude plot and a separate phase plot). c) Use MATLAB to
generate and plot the signal as a DTFS expansion of the periodic
signal. Plot over an interval containing several periods. Make sure
to include the MATLAB code
x[ri] -9 63 3 9 12 n 1. For the periodic DT signal shown in Top, a) determine the Fourier...
Most questions answered within 3 hours.
-
Where is the error in this code sequence?
String s1 = "Hello";
String s2 = "ello";...
asked 10 months ago -
Financial data for Joel de Paris, Inc., for last year
follow:
Joel de Paris, Inc.
Balance...
asked 10 months ago -
Consider this reaction:
Al2(SO4)3 (aq)+ BaCl3
(aq) Al2Cl6 (aq)- +
3BaSO4(s) . What is the...
asked 10 months ago -
Suppose that Savneet is considering increasing her
recent random sample from 20 car rentals to 40...
asked 10 months ago -
Trucks arrive at an unloading terminal at an average rate of 120
per hour.
Trucks arrive...
asked 10 months ago -
Why are methanol and ethanol completely soluble in water while
octanol is not very little soluble....
asked 10 months ago -
A facilities manager at a university reads in a research report
that the mean amount of...
asked 10 months ago -
When the CuSO4 is rehydrated by adding water to the anhydrous
compound, is this an endothermic...
asked 10 months ago -
A ray of sunlight is passing from diamond into crown glass; the
angle of incidence is...
asked 10 months ago -
A block of mass 0.249 kg is placed on top of a light, vertical
spring of...
asked 10 months ago -
how do the kidneys compensate in the presences of acidosis
a) trigger hyperventilate
b) reserve acid...
asked 10 months ago -
Question 501 pts
The rental rate of capital to the firm increases. Which of the
following...
asked 10 months ago