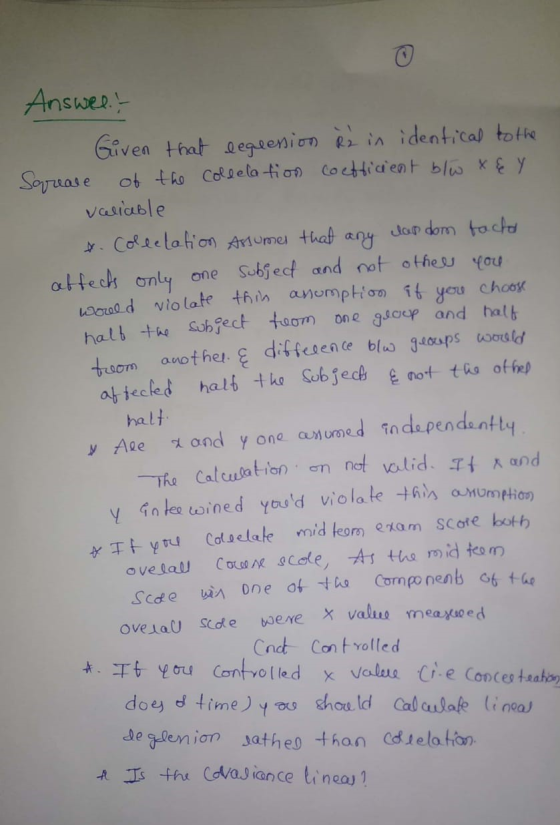
Prove that the regression R2 is identical to the square of the correlation coefficient between two...
Prove that the regression R2 is identical to the square of the correlation coefficient between two variables Y and X. Regression functions are written in a form that suggests causation running from X to Y. Given your proof, does a high regression R2 present supportive evidence of a causal relationship? Can you think of some regression examples where the direction of causality is not clear? Is without a doubt
Homework Answers


Add Answer to:
Prove that the regression R2 is identical to the square of the
correlation coefficient between two...
The association between the variables "chance of health problems" and "weekly cigarette consumption" would typically be...
The association between the variables "chance of health problems" and "weekly cigarette consumption" would typically be a. Positive b. Negative c. Neither If the correlation coefficient for a linear regression is 1.00. there is solid proof that a true cause-effect relationship exists between the x and y data a. True b. False If the correlation coefficient for a lnear regression is -0.932. there is sufficient evidence that a linear relationship exists between the x and y data a. True b....
A regression was run to determine if there is a relationship between hours of TV watched...
A regression was run to determine if there is a relationship between hours of TV watched per day (x) and the number of sit-ups a person can do (y). The results were: y = a+bx b = -0.79 a = 23.59 r2 = 0.6551 If a person watches 16 hours of television a day, predict how many sit-ups he can do. 10.95 Correct What is the value of the correlation coefficient? Round to three decimal places. .809 - I need...
Drop down options are durability, impact properties, shock absorbing capabilities, the two independent variables. A regression...
 Drop down options are durability, impact properties, shock
absorbing capabilities, the two independent variables.
A regression analysis is performed to predict the durability of a brand of running shoe, based on the shock-absorbing capability and the change in impact properties over time. The resulting ANOVA table is below. Complete parts (a) through (d). Degrees of Sum of Freedom Squares Regression Error Total 10.45577 6.46314 16.91891 Mean Square 5.22789 0.28101 p-value 0.00002 18.60 2 23 25 a. Determine whether there is...
Drop down options are durability, impact properties, shock
absorbing capabilities, the two independent variables.
A regression analysis is performed to predict the durability of a brand of running shoe, based on the shock-absorbing capability and the change in impact properties over time. The resulting ANOVA table is below. Complete parts (a) through (d). Degrees of Sum of Freedom Squares Regression Error Total 10.45577 6.46314 16.91891 Mean Square 5.22789 0.28101 p-value 0.00002 18.60 2 23 25 a. Determine whether there is...
Help with some data science questions Q.1 The linear regression model assumes multivariate normality, no or...
Help with some data science questions Q.1 The linear regression model assumes multivariate normality, no or little multicollinearity, no auto-correlation, and homoscedasticity? Which assumption is missing from this list? (no more than 10 words) Q.2 The coefficient of correlation measures the percent change in the feature variables explained by the target variables. a) True b) False Q.3 In a linear regression model, the coefficient measures the change in Y explained by one unit-change in X. a) True b) False Q4....
The (population) correlation coefficient, called p, is discussed in Section 4.5.2 of your text. Given two...
 The (population) correlation coefficient, called p, is discussed in Section 4.5.2 of your text. Given two random variables X and Y with some joint distribution and means ux and uy, p= Corr(X,Y) = Cov(X, Y), where σχσY oſ = Var(x), of = Var(y) and Cov(X,Y) = E[(X - MX)(Y – My)] Given data, we can estimate p. Suppose that (X1,Y1), ..., (Xn, Yn) are independent and iden- tically distributed (i.i.d.) pairs of realizations of the random variables (X, Y). How...
Regression and Correlation Methods: Correlation, ANOVA, and Least Squares This is another way of assessing the...
Regression and Correlation Methods: Correlation, ANOVA, and Least Squares This is another way of assessing the possible association between a normally distributed variable y and a categorical variable x. These techniques are special cases of linear regression methods. The purpose of the assignment is to demonstrate methods of regression and correlation analysis in which two different variables in the same sample are related. The following are three important statistics, or methodologies, for using correlation and regression: Pearson's correlation coefficient ANOVA...
Question 1 1 pts The equation of the regression line between two variables x (independent variable)...
 Question 1 1 pts The equation of the regression line between two variables x (independent variable) and y (dependent variable) is given by ý = -3x -- 2; and the correlation coefficient iss =-.95. The possible x- values range from 1 to 10. Based on the given r, which of the following conclusions may be made? X and Y are very weakly correlated. and y are moderately correlated, and y tends to increase as x is increased. X and y...
Assume for a moment that these 20 houses made up the entire population of houses in San Antonio. Use the Data Analysis...
 Assume for a moment that these 20 houses made up the entire population of houses in San Antonio. Use the Data Analysis Sampling function to choose a random sample of 7 house prices from the population. Put a label called "Sample of 7" over the list you create. 4. 3. Highlight all the data, including both Square Footage and Price, and use the Insert Scatter function to create a Scatter Diagram. Change the title and add a linear trend line...
1) A regression was run to determine if there is a relationship between hours of TV...
1) A regression was run to determine if there is a relationship between hours of TV watched per day (x) and number of situps a person can do (y). The results of the regression were: y=ax+b a=-0.867 b=23.731 r2=0.403225 r=-0.635 Use this to predict the number of situps a person who watches 3 hours of TV can do (to one decimal place) 2)Based on the data shown below, calculate the regression line (each value to two decimal places) y =...
this is concept. 2. A plant distills liquid air to produce oxygen, nitrogen, and argon. The...
 this is concept.
2. A plant distills liquid air to produce oxygen, nitrogen, and argon. The percentage of impurity in the oxygen is thought to be linearly related to the amount of impurities in the air as measured by the pollution count" in part per million (ppm). A sample of plant operating data is shown below. Pollution count (ppm) Purity (%) 933 1145 1.59 92.4 91.7 94 1.08 Purity (%) 946 12 93.6 0.99 0.83 12 932 1.47 1.81 05...
this is concept.
2. A plant distills liquid air to produce oxygen, nitrogen, and argon. The percentage of impurity in the oxygen is thought to be linearly related to the amount of impurities in the air as measured by the pollution count" in part per million (ppm). A sample of plant operating data is shown below. Pollution count (ppm) Purity (%) 933 1145 1.59 92.4 91.7 94 1.08 Purity (%) 946 12 93.6 0.99 0.83 12 932 1.47 1.81 05...
 Drop down options are durability, impact properties, shock
absorbing capabilities, the two independent variables.
A regression analysis is performed to predict the durability of a brand of running shoe, based on the shock-absorbing capability and the change in impact properties over time. The resulting ANOVA table is below. Complete parts (a) through (d). Degrees of Sum of Freedom Squares Regression Error Total 10.45577 6.46314 16.91891 Mean Square 5.22789 0.28101 p-value 0.00002 18.60 2 23 25 a. Determine whether there is...
Drop down options are durability, impact properties, shock
absorbing capabilities, the two independent variables.
A regression analysis is performed to predict the durability of a brand of running shoe, based on the shock-absorbing capability and the change in impact properties over time. The resulting ANOVA table is below. Complete parts (a) through (d). Degrees of Sum of Freedom Squares Regression Error Total 10.45577 6.46314 16.91891 Mean Square 5.22789 0.28101 p-value 0.00002 18.60 2 23 25 a. Determine whether there is...
 The (population) correlation coefficient, called p, is discussed in Section 4.5.2 of your text. Given two random variables X and Y with some joint distribution and means ux and uy, p= Corr(X,Y) = Cov(X, Y), where σχσY oſ = Var(x), of = Var(y) and Cov(X,Y) = E[(X - MX)(Y – My)] Given data, we can estimate p. Suppose that (X1,Y1), ..., (Xn, Yn) are independent and iden- tically distributed (i.i.d.) pairs of realizations of the random variables (X, Y). How...
 Question 1 1 pts The equation of the regression line between two variables x (independent variable) and y (dependent variable) is given by ý = -3x -- 2; and the correlation coefficient iss =-.95. The possible x- values range from 1 to 10. Based on the given r, which of the following conclusions may be made? X and Y are very weakly correlated. and y are moderately correlated, and y tends to increase as x is increased. X and y...
 Assume for a moment that these 20 houses made up the entire population of houses in San Antonio. Use the Data Analysis Sampling function to choose a random sample of 7 house prices from the population. Put a label called "Sample of 7" over the list you create. 4. 3. Highlight all the data, including both Square Footage and Price, and use the Insert Scatter function to create a Scatter Diagram. Change the title and add a linear trend line...
 this is concept.
2. A plant distills liquid air to produce oxygen, nitrogen, and argon. The percentage of impurity in the oxygen is thought to be linearly related to the amount of impurities in the air as measured by the pollution count" in part per million (ppm). A sample of plant operating data is shown below. Pollution count (ppm) Purity (%) 933 1145 1.59 92.4 91.7 94 1.08 Purity (%) 946 12 93.6 0.99 0.83 12 932 1.47 1.81 05...
this is concept.
2. A plant distills liquid air to produce oxygen, nitrogen, and argon. The percentage of impurity in the oxygen is thought to be linearly related to the amount of impurities in the air as measured by the pollution count" in part per million (ppm). A sample of plant operating data is shown below. Pollution count (ppm) Purity (%) 933 1145 1.59 92.4 91.7 94 1.08 Purity (%) 946 12 93.6 0.99 0.83 12 932 1.47 1.81 05...
Most questions answered within 3 hours.
-
Where is the error in this code sequence?
String s1 = "Hello";
String s2 = "ello";...
asked 10 months ago -
Financial data for Joel de Paris, Inc., for last year
follow:
Joel de Paris, Inc.
Balance...
asked 10 months ago -
Consider this reaction:
Al2(SO4)3 (aq)+ BaCl3
(aq) Al2Cl6 (aq)- +
3BaSO4(s) . What is the...
asked 10 months ago -
Suppose that Savneet is considering increasing her
recent random sample from 20 car rentals to 40...
asked 10 months ago -
Trucks arrive at an unloading terminal at an average rate of 120
per hour.
Trucks arrive...
asked 10 months ago -
Why are methanol and ethanol completely soluble in water while
octanol is not very little soluble....
asked 10 months ago -
A facilities manager at a university reads in a research report
that the mean amount of...
asked 10 months ago -
When the CuSO4 is rehydrated by adding water to the anhydrous
compound, is this an endothermic...
asked 10 months ago -
A ray of sunlight is passing from diamond into crown glass; the
angle of incidence is...
asked 10 months ago -
A block of mass 0.249 kg is placed on top of a light, vertical
spring of...
asked 10 months ago -
how do the kidneys compensate in the presences of acidosis
a) trigger hyperventilate
b) reserve acid...
asked 10 months ago -
Question 501 pts
The rental rate of capital to the firm increases. Which of the
following...
asked 10 months ago