
Homework Answers
Dear student, I am waiting for your feedback. I have given my 100% to solve your queries. If you are satisfied by my given answer. Can you please like it☺ Thank You!!!
Add Answer to:
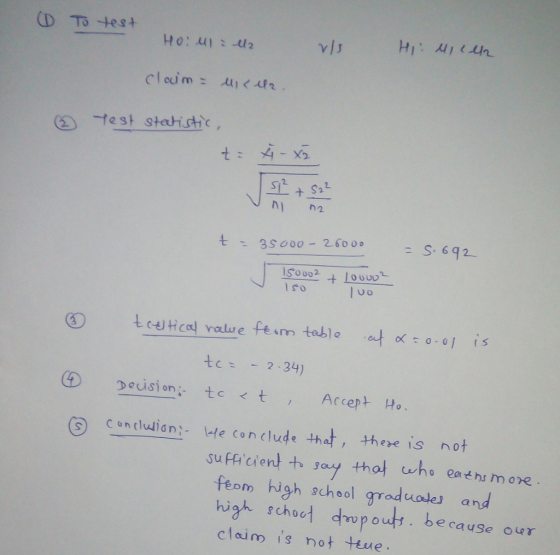
PROBLEM 4: Who carns more? Test at.01 significance level. 515.000,- 150 Hp 00 on school graduates:...
Are these rides equal in terms of monetary revenue? Test at .01 significance level. Tornado: ...
Are these rides equal in terms of monetary revenue? Test at .01 significance level. Tornado: Average daily revenue = $700.00; standard deviation = 150.0; n = 15 Double Blizzard: Average daily revenue = $690.00; standard deviation = 130.0; n = 15 Steps to be covered: State the hypotheses, and identify the claim Find the critical value(s) – you might want to draw the curve Compute the test (statistic) value Make the decision to reject or not reject the...
It seems these days that college graduates who are employed full-time work more than 40-hour weeks....
 It seems these days that college graduates who are employed full-time work more than 40-hour weeks. Data are available that can help us decide if this is true. A survey was recently sent to a group of adults selected at random. There were 11 respondents who were college graduates employed full-time. The mean number of hours worked per week by these 11 respondents was 46 hours, with a standard deviation of 9 hours. Assume that the population of hours worked...
For Problem 1 and 2: A random sample of 16 graduates of a certain secretarial school...
 For Problem 1 and 2: A random sample of 16 graduates of a certain secretarial school typed an average of 85 words per minute with a standard deviation of 8 words per minute. Assume that the number of words typed per minute of a randomly selected graduates follows a normal distribution 1. (4 pts) a 95% confidence interval to estimate the average number of words typed by all graduates of this school. Remember to state the assumptions and interpret the...
The proportion of college graduates who get jobs by networking after graduation is greater than 0.5,...
 The proportion of college graduates who get jobs by networking after graduation is greater than 0.5, as reported by workforce ed. A sample of 200 college graduates reveal that 85 got jobs by networking after graduation. Use the 10% level of significance to test this claim by determining the following 8. What is your hypothesis? 9 What is your decision rule. 10. Determine the test statistic approximated to the place value as the critical value. 11. What is your conclusion....
It seems these days that college graduates who are employed full-time work more than 40-hour weeks....
 It seems these days that college graduates who are employed full-time work more than 40-hour weeks. Data are available that can help us decide if this is true. A survey was recently sent to a group of adults selected at random. There were 15 respondents who were college graduates employed full-time. The mean number of hours worked per week by these 15 respondents was 45 hours, with a standard deviation of 9 hours. Assume that the population of hours worked...
Question 4 1 points Save Anse At the .01 level of significance,, test whether the claim...
 Question 4 1 points Save Anse At the .01 level of significance,, test whether the claim is correct that the variance in the annual temperature in the United States (excluding Hawail and Alaska) is 3.5 degrees Fahrenheit. A sample of the last 101 years in Michigan produced an average annual temperature 44.4 Fwith a variance of 3.8 F What test statistic is appropriate to test the hypothesis?
answer neatly and correctly please! It seems these days that college graduates who are employed full-time...
 answer neatly and correctly
please!
It seems these days that college graduates who are employed full-time work more than 40-hour weeks. Data are available that can help us decide if this is true. A survey was recently sent to a group of adults selected at random. There were 9 respondents who were college graduates employed full-time. The mean number of hours worked per week by these 9 respondents was 43 hours, with a standard deviation of 9 hours. . Can...
answer neatly and correctly
please!
It seems these days that college graduates who are employed full-time work more than 40-hour weeks. Data are available that can help us decide if this is true. A survey was recently sent to a group of adults selected at random. There were 9 respondents who were college graduates employed full-time. The mean number of hours worked per week by these 9 respondents was 43 hours, with a standard deviation of 9 hours. . Can...
#2 please Problem (12 points) Test at 0.05 significance level the claim in a college catalog...
 #2 please
Problem (12 points) Test at 0.05 significance level the claim in a college catalog that the mean price of a textbook at the college bookstore is less than 575. Assume that the prices of textbooks are normally distributed From a random sample of 16 textbooks, a mean of $70.41 with a standard deviation of $19.70, were obtained Problem #2 (12 points) A sample of 54 bears from Yellowstone National Park produces a mean weight of 182.91b. Assuming that...
#2 please
Problem (12 points) Test at 0.05 significance level the claim in a college catalog that the mean price of a textbook at the college bookstore is less than 575. Assume that the prices of textbooks are normally distributed From a random sample of 16 textbooks, a mean of $70.41 with a standard deviation of $19.70, were obtained Problem #2 (12 points) A sample of 54 bears from Yellowstone National Park produces a mean weight of 182.91b. Assuming that...
You wish to test the following claim (HQ) at a significance level of a = 0.002. For the context of this problem, d = 22...
 You wish to test the following claim (HQ) at a significance level of a = 0.002. For the context of this problem, d = 22 - 21 where the first data set represents a pre-test and the second data set represents a post-test. H:Hd = 0 H:Hd > 0 You believe the population of difference scores is normally distributed, but you do not know the standard deviation. You obtain pre-test and post-test samples for n = 12 subjects. The average...
You wish to test the following claim (H) at a significance level of a = 0.05....
 You wish to test the following claim (H) at a significance level of a = 0.05. For the context of this problem, d= 22 - 21 where the first data set represents a pre-test and the second data set represents a post-test. H:Hd = 0 H:Hd < 0 – 11.9 You believe the population of difference scores is normally distributed, but you do not know the standard deviation. You obtain pre-test and post-test samples for n= 85 subjects. The average...
 It seems these days that college graduates who are employed full-time work more than 40-hour weeks. Data are available that can help us decide if this is true. A survey was recently sent to a group of adults selected at random. There were 11 respondents who were college graduates employed full-time. The mean number of hours worked per week by these 11 respondents was 46 hours, with a standard deviation of 9 hours. Assume that the population of hours worked...
 For Problem 1 and 2: A random sample of 16 graduates of a certain secretarial school typed an average of 85 words per minute with a standard deviation of 8 words per minute. Assume that the number of words typed per minute of a randomly selected graduates follows a normal distribution 1. (4 pts) a 95% confidence interval to estimate the average number of words typed by all graduates of this school. Remember to state the assumptions and interpret the...
 The proportion of college graduates who get jobs by networking after graduation is greater than 0.5, as reported by workforce ed. A sample of 200 college graduates reveal that 85 got jobs by networking after graduation. Use the 10% level of significance to test this claim by determining the following 8. What is your hypothesis? 9 What is your decision rule. 10. Determine the test statistic approximated to the place value as the critical value. 11. What is your conclusion....
 It seems these days that college graduates who are employed full-time work more than 40-hour weeks. Data are available that can help us decide if this is true. A survey was recently sent to a group of adults selected at random. There were 15 respondents who were college graduates employed full-time. The mean number of hours worked per week by these 15 respondents was 45 hours, with a standard deviation of 9 hours. Assume that the population of hours worked...
 Question 4 1 points Save Anse At the .01 level of significance,, test whether the claim is correct that the variance in the annual temperature in the United States (excluding Hawail and Alaska) is 3.5 degrees Fahrenheit. A sample of the last 101 years in Michigan produced an average annual temperature 44.4 Fwith a variance of 3.8 F What test statistic is appropriate to test the hypothesis?
 answer neatly and correctly
please!
It seems these days that college graduates who are employed full-time work more than 40-hour weeks. Data are available that can help us decide if this is true. A survey was recently sent to a group of adults selected at random. There were 9 respondents who were college graduates employed full-time. The mean number of hours worked per week by these 9 respondents was 43 hours, with a standard deviation of 9 hours. . Can...
answer neatly and correctly
please!
It seems these days that college graduates who are employed full-time work more than 40-hour weeks. Data are available that can help us decide if this is true. A survey was recently sent to a group of adults selected at random. There were 9 respondents who were college graduates employed full-time. The mean number of hours worked per week by these 9 respondents was 43 hours, with a standard deviation of 9 hours. . Can...
 #2 please
Problem (12 points) Test at 0.05 significance level the claim in a college catalog that the mean price of a textbook at the college bookstore is less than 575. Assume that the prices of textbooks are normally distributed From a random sample of 16 textbooks, a mean of $70.41 with a standard deviation of $19.70, were obtained Problem #2 (12 points) A sample of 54 bears from Yellowstone National Park produces a mean weight of 182.91b. Assuming that...
#2 please
Problem (12 points) Test at 0.05 significance level the claim in a college catalog that the mean price of a textbook at the college bookstore is less than 575. Assume that the prices of textbooks are normally distributed From a random sample of 16 textbooks, a mean of $70.41 with a standard deviation of $19.70, were obtained Problem #2 (12 points) A sample of 54 bears from Yellowstone National Park produces a mean weight of 182.91b. Assuming that...
 You wish to test the following claim (HQ) at a significance level of a = 0.002. For the context of this problem, d = 22 - 21 where the first data set represents a pre-test and the second data set represents a post-test. H:Hd = 0 H:Hd > 0 You believe the population of difference scores is normally distributed, but you do not know the standard deviation. You obtain pre-test and post-test samples for n = 12 subjects. The average...
 You wish to test the following claim (H) at a significance level of a = 0.05. For the context of this problem, d= 22 - 21 where the first data set represents a pre-test and the second data set represents a post-test. H:Hd = 0 H:Hd < 0 – 11.9 You believe the population of difference scores is normally distributed, but you do not know the standard deviation. You obtain pre-test and post-test samples for n= 85 subjects. The average...
Most questions answered within 3 hours.
-
Where is the error in this code sequence?
String s1 = "Hello";
String s2 = "ello";...
asked 10 months ago -
Financial data for Joel de Paris, Inc., for last year
follow:
Joel de Paris, Inc.
Balance...
asked 10 months ago -
Consider this reaction:
Al2(SO4)3 (aq)+ BaCl3
(aq) Al2Cl6 (aq)- +
3BaSO4(s) . What is the...
asked 10 months ago -
Suppose that Savneet is considering increasing her
recent random sample from 20 car rentals to 40...
asked 10 months ago -
Trucks arrive at an unloading terminal at an average rate of 120
per hour.
Trucks arrive...
asked 10 months ago -
Why are methanol and ethanol completely soluble in water while
octanol is not very little soluble....
asked 10 months ago -
A facilities manager at a university reads in a research report
that the mean amount of...
asked 10 months ago -
When the CuSO4 is rehydrated by adding water to the anhydrous
compound, is this an endothermic...
asked 10 months ago -
A ray of sunlight is passing from diamond into crown glass; the
angle of incidence is...
asked 10 months ago -
A block of mass 0.249 kg is placed on top of a light, vertical
spring of...
asked 10 months ago -
how do the kidneys compensate in the presences of acidosis
a) trigger hyperventilate
b) reserve acid...
asked 10 months ago -
Question 501 pts
The rental rate of capital to the firm increases. Which of the
following...
asked 10 months ago