Note: for the Bode plots, you are expected to draw
t
hem by hand (and not use
computer).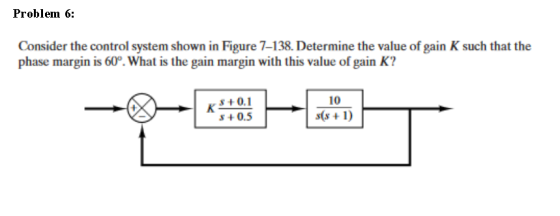
Homework Answers


Add Answer to:
Note: for the Bode plots, you are expected to draw
t
hem by hand (and not...
Consider the digital control system shown in figure below. Draw a Bode diagram in the w...
 Consider the digital control system shown in figure below. Draw a Bode diagram in the w plane. Set the gain K so that the phase margin becomes equal to 50°. With the gain K so set, determine the gain margin and the static velocity error constant Kv The sampling period is as sumed to be 0.1 sec, or T-0.1 ctt) -Ts rtr ss 10) Gls)
Problem 4 (25 points): Consider the following system: s0.1 8+0.5 10 s(s+1 Draw the gain and...
 Problem 4 (25 points): Consider the following system: s0.1 8+0.5 10 s(s+1 Draw the gain and phase Bode plots of the open-loop transfer function (see other side for plot). A. B. Determine the value of the gain K such that the phase margin is 50° C. For the gain K from part (B), what is the gain margin of the system?
Consider the system given below where K is a constant gain, Gp is the plant, and Ge is a compensator. The Bode Plots of a Gp is given below. Problem 1: Bode Diagram 20 2 40 -60 80 -100 90 135 180 a 2...
 Consider the system given below where K is a constant gain, Gp is the plant, and Ge is a compensator. The Bode Plots of a Gp is given below. Problem 1: Bode Diagram 20 2 40 -60 80 -100 90 135 180 a 225 270 101 10 Frequency (rad/s) 102 a. Looking at the low frequency behavior, determine its number of poles at origin. Explain. b. Looking at the high frequency behavior, determine the number of excess poles. Explain. C....
i) Draw the Bode plots (hand sketch, magnitude and phase!) for the following transfer function. Plot...
 i) Draw the Bode plots (hand sketch, magnitude and phase!) for the following transfer function. Plot over the range 0.1 to 1000 rad/s HS 10,000 (s) = s* + 20s 10,000 ii) what are the Q and Bw for this circuit? iii) Design and draw a circuit (including values) that would yield this transfer function. It should use a 100mH inductor , , Qano
Consider the system shown as below. Draw a Bode diagram of the open-loop transfer function G(s).
 1 Consider the system shown as below. Draw a Bode diagram of the open-loop transfer function G(s). Determine the phase margin, gain-crossover frequency, gain margin and phase-crossover frequency, (Sketch the bode diagram by hand) 2 Consider the system shown as below. Use MATLAB to draw a bode diagram of the open-loop transfer function G(s). Show the gain-crossover frequency and phase-crossover frequency in the Bode diagram and determine the phase margin and gain margin. 3. Consider the system shown as below. Design a...
For the given system (s+25) P(s) s(s+1)(s+3000) 1. Sketch, by hand, the Bode asymptote plots for phase and magnitude. S...
 For the given system (s+25) P(s) s(s+1)(s+3000) 1. Sketch, by hand, the Bode asymptote plots for phase and magnitude. Show all your work 2. Sketch by hand the Nyquist plot of the system 3. What is the system's upward, downward gain margins?
For the given system (s+25) P(s) s(s+1)(s+3000) 1. Sketch, by hand, the Bode asymptote plots for phase and magnitude. Show all your work 2. Sketch by hand the Nyquist plot of the system 3. What is the system's...
For the given system (s+25) P(s) s(s+1)(s+3000) 1. Sketch, by hand, the Bode asymptote plots for phase and magnitude. Show all your work 2. Sketch by hand the Nyquist plot of the system 3. What is the system's upward, downward gain margins?
For the given system (s+25) P(s) s(s+1)(s+3000) 1. Sketch, by hand, the Bode asymptote plots for phase and magnitude. Show all your work 2. Sketch by hand the Nyquist plot of the system 3. What is the system's...
Continues control system. The first word in the question is “Draw “individual plots idual plots f...
 Continues control system. The first word in the question is
“Draw “individual plots
idual plots f gain and phase plots) for following transfer function or each pole and/or zero as well as complete asymptotic bode plots (both 100 G(s) (s + 10) (s2+1.5s + 1) 2) Given a svstom
Continues control system. The first word in the question is
“Draw “individual plots
idual plots f gain and phase plots) for following transfer function or each pole and/or zero as well as complete asymptotic bode plots (both 100 G(s) (s + 10) (s2+1.5s + 1) 2) Given a svstom
5. The open loop transfer function of a control system is s(1 +0.5s)(1 0.67s) Draw a Bode diagram...
 5. The open loop transfer function of a control system is s(1 +0.5s)(1 0.67s) Draw a Bode diagram for the system and determine the phase margin and gain margin. Is the closed loop system stable? (a) (17 marks) (b) By how much must the gain be adjusted for a phase margin of 50°? (8 marks)
5. The open loop transfer function of a control system is s(1 +0.5s)(1 0.67s) Draw a Bode diagram for the system and determine the phase...
5. The open loop transfer function of a control system is s(1 +0.5s)(1 0.67s) Draw a Bode diagram for the system and determine the phase margin and gain margin. Is the closed loop system stable? (a) (17 marks) (b) By how much must the gain be adjusted for a phase margin of 50°? (8 marks)
5. The open loop transfer function of a control system is s(1 +0.5s)(1 0.67s) Draw a Bode diagram for the system and determine the phase...
Figure 1 Problem 3 For the system shown in the above figure, where G(s) a) Draw...
 Figure 1 Problem 3 For the system shown in the above figure, where G(s) a) Draw a Bode diagram of the open-loop transfer function G(s) when K 10. b) On your plot, indicate the crossover frequencies, PM, and GM. Is the closed-loop system stable with K-10? c) Determine the value of K such that the phase margin is 30°. What are the gain margin and the crossover frequencies with this K? Note: You can finish problems 2-3 with the help...
USE EXCEL i dont get what you mean!!! An industrial plant has the following transfer function:...
 USE EXCEL
i
dont get what you mean!!!
An industrial plant has the following transfer function: K G(S) = s(S+1)(s + 3) The industrial plant forms the forward path of a negative feedback control system with unity feedback (i) Draw the root locus of this control system. (ii) Using a suitable software program, perform the frequency analysis of the control system using the following techniques, assuming K 1: (a) Nyquist (Polar) Plot (b) Nichols Chart (c) Bode Plots (ii) Repeat...
USE EXCEL
i
dont get what you mean!!!
An industrial plant has the following transfer function: K G(S) = s(S+1)(s + 3) The industrial plant forms the forward path of a negative feedback control system with unity feedback (i) Draw the root locus of this control system. (ii) Using a suitable software program, perform the frequency analysis of the control system using the following techniques, assuming K 1: (a) Nyquist (Polar) Plot (b) Nichols Chart (c) Bode Plots (ii) Repeat...
 Consider the digital control system shown in figure below. Draw a Bode diagram in the w plane. Set the gain K so that the phase margin becomes equal to 50°. With the gain K so set, determine the gain margin and the static velocity error constant Kv The sampling period is as sumed to be 0.1 sec, or T-0.1 ctt) -Ts rtr ss 10) Gls)
 Problem 4 (25 points): Consider the following system: s0.1 8+0.5 10 s(s+1 Draw the gain and phase Bode plots of the open-loop transfer function (see other side for plot). A. B. Determine the value of the gain K such that the phase margin is 50° C. For the gain K from part (B), what is the gain margin of the system?
 Consider the system given below where K is a constant gain, Gp is the plant, and Ge is a compensator. The Bode Plots of a Gp is given below. Problem 1: Bode Diagram 20 2 40 -60 80 -100 90 135 180 a 225 270 101 10 Frequency (rad/s) 102 a. Looking at the low frequency behavior, determine its number of poles at origin. Explain. b. Looking at the high frequency behavior, determine the number of excess poles. Explain. C....
 i) Draw the Bode plots (hand sketch, magnitude and phase!) for the following transfer function. Plot over the range 0.1 to 1000 rad/s HS 10,000 (s) = s* + 20s 10,000 ii) what are the Q and Bw for this circuit? iii) Design and draw a circuit (including values) that would yield this transfer function. It should use a 100mH inductor , , Qano
 For the given system (s+25) P(s) s(s+1)(s+3000) 1. Sketch, by hand, the Bode asymptote plots for phase and magnitude. Show all your work 2. Sketch by hand the Nyquist plot of the system 3. What is the system's upward, downward gain margins?
For the given system (s+25) P(s) s(s+1)(s+3000) 1. Sketch, by hand, the Bode asymptote plots for phase and magnitude. Show all your work 2. Sketch by hand the Nyquist plot of the system 3. What is the system's...
For the given system (s+25) P(s) s(s+1)(s+3000) 1. Sketch, by hand, the Bode asymptote plots for phase and magnitude. Show all your work 2. Sketch by hand the Nyquist plot of the system 3. What is the system's upward, downward gain margins?
For the given system (s+25) P(s) s(s+1)(s+3000) 1. Sketch, by hand, the Bode asymptote plots for phase and magnitude. Show all your work 2. Sketch by hand the Nyquist plot of the system 3. What is the system's...
 Continues control system. The first word in the question is
“Draw “individual plots
idual plots f gain and phase plots) for following transfer function or each pole and/or zero as well as complete asymptotic bode plots (both 100 G(s) (s + 10) (s2+1.5s + 1) 2) Given a svstom
Continues control system. The first word in the question is
“Draw “individual plots
idual plots f gain and phase plots) for following transfer function or each pole and/or zero as well as complete asymptotic bode plots (both 100 G(s) (s + 10) (s2+1.5s + 1) 2) Given a svstom
 5. The open loop transfer function of a control system is s(1 +0.5s)(1 0.67s) Draw a Bode diagram for the system and determine the phase margin and gain margin. Is the closed loop system stable? (a) (17 marks) (b) By how much must the gain be adjusted for a phase margin of 50°? (8 marks)
5. The open loop transfer function of a control system is s(1 +0.5s)(1 0.67s) Draw a Bode diagram for the system and determine the phase...
5. The open loop transfer function of a control system is s(1 +0.5s)(1 0.67s) Draw a Bode diagram for the system and determine the phase margin and gain margin. Is the closed loop system stable? (a) (17 marks) (b) By how much must the gain be adjusted for a phase margin of 50°? (8 marks)
5. The open loop transfer function of a control system is s(1 +0.5s)(1 0.67s) Draw a Bode diagram for the system and determine the phase...
 Figure 1 Problem 3 For the system shown in the above figure, where G(s) a) Draw a Bode diagram of the open-loop transfer function G(s) when K 10. b) On your plot, indicate the crossover frequencies, PM, and GM. Is the closed-loop system stable with K-10? c) Determine the value of K such that the phase margin is 30°. What are the gain margin and the crossover frequencies with this K? Note: You can finish problems 2-3 with the help...
 USE EXCEL
i
dont get what you mean!!!
An industrial plant has the following transfer function: K G(S) = s(S+1)(s + 3) The industrial plant forms the forward path of a negative feedback control system with unity feedback (i) Draw the root locus of this control system. (ii) Using a suitable software program, perform the frequency analysis of the control system using the following techniques, assuming K 1: (a) Nyquist (Polar) Plot (b) Nichols Chart (c) Bode Plots (ii) Repeat...
USE EXCEL
i
dont get what you mean!!!
An industrial plant has the following transfer function: K G(S) = s(S+1)(s + 3) The industrial plant forms the forward path of a negative feedback control system with unity feedback (i) Draw the root locus of this control system. (ii) Using a suitable software program, perform the frequency analysis of the control system using the following techniques, assuming K 1: (a) Nyquist (Polar) Plot (b) Nichols Chart (c) Bode Plots (ii) Repeat...
Most questions answered within 3 hours.
-
Where is the error in this code sequence?
String s1 = "Hello";
String s2 = "ello";...
asked 10 months ago -
Financial data for Joel de Paris, Inc., for last year
follow:
Joel de Paris, Inc.
Balance...
asked 10 months ago -
Consider this reaction:
Al2(SO4)3 (aq)+ BaCl3
(aq) Al2Cl6 (aq)- +
3BaSO4(s) . What is the...
asked 10 months ago -
Suppose that Savneet is considering increasing her
recent random sample from 20 car rentals to 40...
asked 10 months ago -
Trucks arrive at an unloading terminal at an average rate of 120
per hour.
Trucks arrive...
asked 10 months ago -
Why are methanol and ethanol completely soluble in water while
octanol is not very little soluble....
asked 10 months ago -
A facilities manager at a university reads in a research report
that the mean amount of...
asked 10 months ago -
When the CuSO4 is rehydrated by adding water to the anhydrous
compound, is this an endothermic...
asked 10 months ago -
A ray of sunlight is passing from diamond into crown glass; the
angle of incidence is...
asked 10 months ago -
A block of mass 0.249 kg is placed on top of a light, vertical
spring of...
asked 10 months ago -
how do the kidneys compensate in the presences of acidosis
a) trigger hyperventilate
b) reserve acid...
asked 10 months ago -
Question 501 pts
The rental rate of capital to the firm increases. Which of the
following...
asked 10 months ago