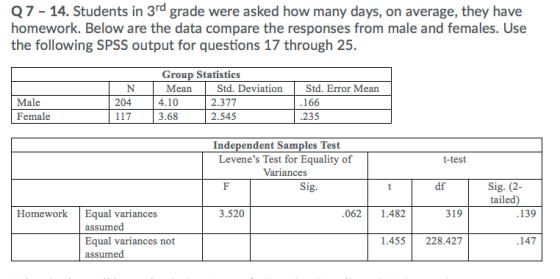
What is the null hypothesis for Levene’s Test for Equality of
Variances?
Tested at a .05 level of significance, the Levene’s F-test in the
output shows that
a.Means are significantly different
b.Means are not significantly different
c.Variances are significantly different
d.Variances are not significantly different
What is the null hypothesis to test the statement that the average
amount of days spent doing homework is different for males and
females?
What is the alternative hypothesis to test the statement that the
average amount of days spent doing homework is different for males
and females?
On the SPSS output above, what the test statistic and significance
value used to assess the hypothesis that the average amount of days
spent doing homework is different for males and females?
Summarize the findings of the independent-samples t-test
(?=.05?=.05).
a.Males spent significantly more time doing homework than
females.
b.Males spent more time doing homework than females, but the
difference was not significant.
c.Females spent significantly more time doing homework than
males.
d.Females spent more time doing homework than males, but the
difference was not significant.
What is the probability that a Type I error was made?
a. .00
b.Between .00 and .05
c.Between .00 and .05
d.Greater than .10
What is the effect size of the difference?
a.0.000
b.0.012
c.0.019
d.0.110
Homework Answers

Add Answer to:
What is the null hypothesis for Levene’s Test for Equality of
Variances?
Tested at a .05...
Do males and females have significant different GPAs? Following is the output of analysis for 26...
 Do males and females have significant different GPAs? Following is
the output of analysis for 26 males and 25 females.
1. Which of the following statements are true regarding
Levene’s F-test using a .05 level of significance?
a. Means are significantly different
b. Means are not significantly different
c. Variances are significantly different
d.Variances are not significantly different
2. From the chart above, what is the correct t-value, df, and Sig.
used for the t-test:
a. t(49)=0.326, p>0.05
b.t(49)=0.330, p>0.05...
Do males and females have significant different GPAs? Following is
the output of analysis for 26 males and 25 females.
1. Which of the following statements are true regarding
Levene’s F-test using a .05 level of significance?
a. Means are significantly different
b. Means are not significantly different
c. Variances are significantly different
d.Variances are not significantly different
2. From the chart above, what is the correct t-value, df, and Sig.
used for the t-test:
a. t(49)=0.326, p>0.05
b.t(49)=0.330, p>0.05...
The null hypothesis states there will be no difference in scores on the ADS between face-to-face...
The null hypothesis states there will be no difference in scores on the ADS between face-to-face counseling and video conference counseling. The results are t(38) = 0.258, p = .798. Group Statistics Group N Mean Std. Deviation Std. Error Mean ADS face to face video 20 20 9.2500 9.0000 3.14350 2.97357 .70291 .66491 Independent Samples Test Levene’s Test for Equality of variance t-test for Equality of Means F Sig. t df Sig. (2-tailed) Mean Difference Std. Error Difference 95% Confidence...
Imagine that you are next interested in discovering whether or not there are differences in minutes...
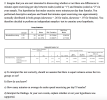 Imagine that you are next interested in discovering whether or
not there are differences in minutes spent exercising per day
between males (coded as “1”) and females (coded as “2”) in your
sample. You hypothesize that males exercise more minutes per day
than females. You performed descriptive analyses and found that
minutes spent exercising was approximately normally distributed in
both groups (skewness = .26 for males, skewness = .07 for females).
You therefore decided to perform an independent samples t...
Imagine that you are next interested in discovering whether or
not there are differences in minutes spent exercising per day
between males (coded as “1”) and females (coded as “2”) in your
sample. You hypothesize that males exercise more minutes per day
than females. You performed descriptive analyses and found that
minutes spent exercising was approximately normally distributed in
both groups (skewness = .26 for males, skewness = .07 for females).
You therefore decided to perform an independent samples t...
The output below is for a t-test for the hypothesis: Individuals living in bad neighborhoods commit...
 The output below is for a t-test for the hypothesis: Individuals
living in bad neighborhoods commit more crime than those living in
good neighborhoods. The data in the Group Statistics section
provides you with the average number of crimes committed by
individuals living in good and bad neighborhoods and the standard
deviation of this same variable. The findings of significance are
located in the Independent Samples Test section. Pay particular
attention to the "t" column and the "Sig (2-tailed)"column. The...
The output below is for a t-test for the hypothesis: Individuals
living in bad neighborhoods commit more crime than those living in
good neighborhoods. The data in the Group Statistics section
provides you with the average number of crimes committed by
individuals living in good and bad neighborhoods and the standard
deviation of this same variable. The findings of significance are
located in the Independent Samples Test section. Pay particular
attention to the "t" column and the "Sig (2-tailed)"column. The...
Scenario for 2-5: Research question: Is there a difference in the infant mortality rates of states...
 Scenario for 2-5: Research question: Is there a difference in the infant mortality rates of states above and below the mean income? Use the SPSS output below. Test the mean difference and the assumption of equal variances at the .05 level. Group Statistics N INCGROUP INFMORT Infant mortalit 1.00 below mean rate (per 1000 live births) 2.00 above mear 28 23 Mean 7.9464 6.7435 Std. Deviation 2.0224 1.1878 Std. Error Mean .3822 2477 Lovene's Test for Equality of Variances t-test...
Let’s test, with our student data, whether online students spend a different amount of time on...
 Let’s test, with our student data, whether online students spend
a different amount of time on their study plan than face-to-face
students. Use an α=0.05. Do not assume population standard
deviations are equal.
Write the probability statement for your p-value with the
correct. (Hint: Double check what the p-value given in the SPSS
output is for, how many tails?)
Make your decision.
Draw conclusions.
Using all of the previous Real World problems, write a brief
description of what you have...
Let’s test, with our student data, whether online students spend
a different amount of time on their study plan than face-to-face
students. Use an α=0.05. Do not assume population standard
deviations are equal.
Write the probability statement for your p-value with the
correct. (Hint: Double check what the p-value given in the SPSS
output is for, how many tails?)
Make your decision.
Draw conclusions.
Using all of the previous Real World problems, write a brief
description of what you have...
Scenario for 2-5: Research question: Is there a difference in the infant mortality rates of states...
 Scenario for 2-5: Research question: Is there a difference in the infant mortality rates of states above and below the mean income? Use the SPSS output below. Test the mean difference and the assumption of equal variances at the .05 level. Group Statistics N INCGROUP INFMORT Infant mortalit 1.00 below mean rate (per 1000 live births) 2.00 above mear 28 23 Mean 7.9464 6.7435 Std. Deviation 2.0224 1.1878 Std. Error Mean .3822 .2477 Levene's Test for Equality of Variances t-test...
1. ANOVA is a statistical method for verifying the equality between some sample means b. a....
 1. ANOVA is a statistical method for verifying the equality between some sample means b. a. some sample standard deviations c. some population standard deviations d some population means Salary information regarding male and female employees of a large company is shown below Sample Size Male (Pop. 1) Female (Pop. 2) 49 47 Sample Mean Salary (in $1,000) , Population Variance 2. The point estimate of the difference μ-μ, between the two population means is Y 7-44-3.0 3. The margin...
What can you conclude from these results? Is Betty’s hypothesis supported? Betty has the following hypothesis:...
 What can you conclude from these results? Is Betty’s
hypothesis supported?
Betty has the following hypothesis: Women are more likely to believe that hard work leads to success than men are. Betty ran a comparison of means test on survey data and had the following results from SPSS. The variable about "hard work" ranges from 1 to 10 with 1 being the strongest belief that hard work brings success and 10 being the strongest belief that hard work does NOT...
What can you conclude from these results? Is Betty’s
hypothesis supported?
Betty has the following hypothesis: Women are more likely to believe that hard work leads to success than men are. Betty ran a comparison of means test on survey data and had the following results from SPSS. The variable about "hard work" ranges from 1 to 10 with 1 being the strongest belief that hard work brings success and 10 being the strongest belief that hard work does NOT...
You decide to use an alpha level of .05. Based on this, your degrees of freedom,...
You decide to use an alpha level of .05. Based on this, your degrees of freedom, and your hypothesis type (one tailed or two tailed), you determine that your critical region consists of t values greater than or less than . IMPORTANT NOTES: 1. The row with ∞ in the degrees of freedom column is used any time the degrees of freedom exceed 120. 2. Enter your answers to THREE decimal places. If the answer is positive, enter a +...
 Do males and females have significant different GPAs? Following is
the output of analysis for 26 males and 25 females.
1. Which of the following statements are true regarding
Levene’s F-test using a .05 level of significance?
a. Means are significantly different
b. Means are not significantly different
c. Variances are significantly different
d.Variances are not significantly different
2. From the chart above, what is the correct t-value, df, and Sig.
used for the t-test:
a. t(49)=0.326, p>0.05
b.t(49)=0.330, p>0.05...
Do males and females have significant different GPAs? Following is
the output of analysis for 26 males and 25 females.
1. Which of the following statements are true regarding
Levene’s F-test using a .05 level of significance?
a. Means are significantly different
b. Means are not significantly different
c. Variances are significantly different
d.Variances are not significantly different
2. From the chart above, what is the correct t-value, df, and Sig.
used for the t-test:
a. t(49)=0.326, p>0.05
b.t(49)=0.330, p>0.05...
 Imagine that you are next interested in discovering whether or
not there are differences in minutes spent exercising per day
between males (coded as “1”) and females (coded as “2”) in your
sample. You hypothesize that males exercise more minutes per day
than females. You performed descriptive analyses and found that
minutes spent exercising was approximately normally distributed in
both groups (skewness = .26 for males, skewness = .07 for females).
You therefore decided to perform an independent samples t...
Imagine that you are next interested in discovering whether or
not there are differences in minutes spent exercising per day
between males (coded as “1”) and females (coded as “2”) in your
sample. You hypothesize that males exercise more minutes per day
than females. You performed descriptive analyses and found that
minutes spent exercising was approximately normally distributed in
both groups (skewness = .26 for males, skewness = .07 for females).
You therefore decided to perform an independent samples t...
 The output below is for a t-test for the hypothesis: Individuals
living in bad neighborhoods commit more crime than those living in
good neighborhoods. The data in the Group Statistics section
provides you with the average number of crimes committed by
individuals living in good and bad neighborhoods and the standard
deviation of this same variable. The findings of significance are
located in the Independent Samples Test section. Pay particular
attention to the "t" column and the "Sig (2-tailed)"column. The...
The output below is for a t-test for the hypothesis: Individuals
living in bad neighborhoods commit more crime than those living in
good neighborhoods. The data in the Group Statistics section
provides you with the average number of crimes committed by
individuals living in good and bad neighborhoods and the standard
deviation of this same variable. The findings of significance are
located in the Independent Samples Test section. Pay particular
attention to the "t" column and the "Sig (2-tailed)"column. The...
 Scenario for 2-5: Research question: Is there a difference in the infant mortality rates of states above and below the mean income? Use the SPSS output below. Test the mean difference and the assumption of equal variances at the .05 level. Group Statistics N INCGROUP INFMORT Infant mortalit 1.00 below mean rate (per 1000 live births) 2.00 above mear 28 23 Mean 7.9464 6.7435 Std. Deviation 2.0224 1.1878 Std. Error Mean .3822 2477 Lovene's Test for Equality of Variances t-test...
 Let’s test, with our student data, whether online students spend
a different amount of time on their study plan than face-to-face
students. Use an α=0.05. Do not assume population standard
deviations are equal.
Write the probability statement for your p-value with the
correct. (Hint: Double check what the p-value given in the SPSS
output is for, how many tails?)
Make your decision.
Draw conclusions.
Using all of the previous Real World problems, write a brief
description of what you have...
Let’s test, with our student data, whether online students spend
a different amount of time on their study plan than face-to-face
students. Use an α=0.05. Do not assume population standard
deviations are equal.
Write the probability statement for your p-value with the
correct. (Hint: Double check what the p-value given in the SPSS
output is for, how many tails?)
Make your decision.
Draw conclusions.
Using all of the previous Real World problems, write a brief
description of what you have...
 Scenario for 2-5: Research question: Is there a difference in the infant mortality rates of states above and below the mean income? Use the SPSS output below. Test the mean difference and the assumption of equal variances at the .05 level. Group Statistics N INCGROUP INFMORT Infant mortalit 1.00 below mean rate (per 1000 live births) 2.00 above mear 28 23 Mean 7.9464 6.7435 Std. Deviation 2.0224 1.1878 Std. Error Mean .3822 .2477 Levene's Test for Equality of Variances t-test...
 1. ANOVA is a statistical method for verifying the equality between some sample means b. a. some sample standard deviations c. some population standard deviations d some population means Salary information regarding male and female employees of a large company is shown below Sample Size Male (Pop. 1) Female (Pop. 2) 49 47 Sample Mean Salary (in $1,000) , Population Variance 2. The point estimate of the difference μ-μ, between the two population means is Y 7-44-3.0 3. The margin...
 What can you conclude from these results? Is Betty’s
hypothesis supported?
Betty has the following hypothesis: Women are more likely to believe that hard work leads to success than men are. Betty ran a comparison of means test on survey data and had the following results from SPSS. The variable about "hard work" ranges from 1 to 10 with 1 being the strongest belief that hard work brings success and 10 being the strongest belief that hard work does NOT...
What can you conclude from these results? Is Betty’s
hypothesis supported?
Betty has the following hypothesis: Women are more likely to believe that hard work leads to success than men are. Betty ran a comparison of means test on survey data and had the following results from SPSS. The variable about "hard work" ranges from 1 to 10 with 1 being the strongest belief that hard work brings success and 10 being the strongest belief that hard work does NOT...
Most questions answered within 3 hours.
-
Where is the error in this code sequence?
String s1 = "Hello";
String s2 = "ello";...
asked 11 months ago -
Financial data for Joel de Paris, Inc., for last year
follow:
Joel de Paris, Inc.
Balance...
asked 11 months ago -
Consider this reaction:
Al2(SO4)3 (aq)+ BaCl3
(aq) Al2Cl6 (aq)- +
3BaSO4(s) . What is the...
asked 11 months ago -
Suppose that Savneet is considering increasing her
recent random sample from 20 car rentals to 40...
asked 11 months ago -
Trucks arrive at an unloading terminal at an average rate of 120
per hour.
Trucks arrive...
asked 11 months ago -
Why are methanol and ethanol completely soluble in water while
octanol is not very little soluble....
asked 11 months ago -
A facilities manager at a university reads in a research report
that the mean amount of...
asked 11 months ago -
When the CuSO4 is rehydrated by adding water to the anhydrous
compound, is this an endothermic...
asked 11 months ago -
A ray of sunlight is passing from diamond into crown glass; the
angle of incidence is...
asked 11 months ago -
A block of mass 0.249 kg is placed on top of a light, vertical
spring of...
asked 11 months ago -
how do the kidneys compensate in the presences of acidosis
a) trigger hyperventilate
b) reserve acid...
asked 11 months ago -
Question 501 pts
The rental rate of capital to the firm increases. Which of the
following...
asked 11 months ago