Are name brand groceries more expensive than store brand groceries? The following table shows the prices...
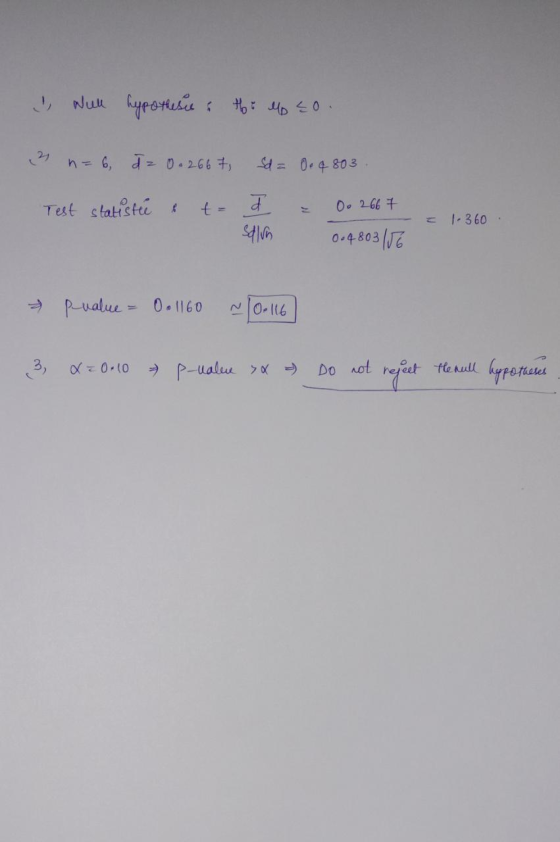
Are name brand groceries more expensive than store brand groceries? The following table shows the prices of 6 commonly purchased items.
| Item | Paper Towels | Shampoo | Cereal | Ice Cream | Peanut Butter | Milk |
| Name Brand | $1.29 | $4.69 | $3.59 | $3.49 | $2.79 | $2.99 |
| Store Brand | $1.29 | $3.99 | $3.39 | $2.69 | $2.39 | $3.49 |
| Difference | 0 | .70 | .20 | .80 | .40 | -.50 |
1. What is the Null Hypothesis?
2. Using the Dependent Samples t-test, what is the p-value rounded to 3 decimal places?
3. Would you reject the null hypothesis at α=.10?
Homework Answers
Add Answer to:
Are name brand groceries more expensive than store brand
groceries? The following table shows the prices...
Here are some prices for randomly selected grocery items from the grocery store: Items Prices: Cheese...
Here are some prices for randomly selected grocery items from the grocery store: Items Prices: Cheese $3.29 Butter $4.99 Eggs $3.49 Yogurt $3.49 Juice $3.89 Tea $3.69 Chips $3.99 Soda $1.99 Pastry $2.99 Cerrial $4.99 Oats $3.29 Almond Milk $2.79 Almonds $4.39 Popcorn $3.29 Crackers $3.59 Ice Cream $6.99 Cookies $2.99 Jam $3.69 Peanut Butter $3.29 Coffee $3.19 Green Tea $4.99 BBQ Sauce $2.99 Oil $6.69 Mayonnaise $4.59 Mustard $2.99 1. Compute the sample mean x and the sample standard...
Comparing Grocery Prices Consumer groups often analyze store prices and compare the price of similar items...
 Comparing Grocery Prices Consumer groups often analyze store prices and compare the price of similar items in different stores. They share this information with other consumers or customers. Imagine that a consumer group suspects that there is a difference in prices between two grocery stores (Store A and Store B). To investigate, the consumer group identifies the prices of six identical items at Stores A and B. Since prices change over time, the consumer group gathers all data on a...
The median wage for economics degree holders is determined by the following equation: log( wage) = Be...
 The median wage for economics degree holders is determined by the following equation: log( wage) = Be + B educ + B, exper+ B temure + B.age+ B married + u where educ is the level of education measured in years, exper is the job-market experience in years, tenure is the time spend with the current company in years, age is the age in years and married is a dummy variable indicating if a person is married. 935 reg Iwage...
1. Two manufacturing processes are being compared to try to reduce the number of defective products...
 1. Two manufacturing processes are being compared to try to reduce the number of defective products made. During 8 shifts for each process, the following results were observed: Line A Line B n 181 | 187 Based on a 5% significance level, did line B have a larger average than line A? *Use the tables I gave you in the handouts for the critical values *Use the appropriate test statistic value, NOT the p-value method *Use and show the 5...
 Comparing Grocery Prices Consumer groups often analyze store prices and compare the price of similar items in different stores. They share this information with other consumers or customers. Imagine that a consumer group suspects that there is a difference in prices between two grocery stores (Store A and Store B). To investigate, the consumer group identifies the prices of six identical items at Stores A and B. Since prices change over time, the consumer group gathers all data on a...
 The median wage for economics degree holders is determined by the following equation: log( wage) = Be + B educ + B, exper+ B temure + B.age+ B married + u where educ is the level of education measured in years, exper is the job-market experience in years, tenure is the time spend with the current company in years, age is the age in years and married is a dummy variable indicating if a person is married. 935 reg Iwage...
 1. Two manufacturing processes are being compared to try to reduce the number of defective products made. During 8 shifts for each process, the following results were observed: Line A Line B n 181 | 187 Based on a 5% significance level, did line B have a larger average than line A? *Use the tables I gave you in the handouts for the critical values *Use the appropriate test statistic value, NOT the p-value method *Use and show the 5...
Most questions answered within 3 hours.
-
Where is the error in this code sequence?
String s1 = "Hello";
String s2 = "ello";...
asked 10 months ago -
Financial data for Joel de Paris, Inc., for last year
follow:
Joel de Paris, Inc.
Balance...
asked 10 months ago -
Consider this reaction:
Al2(SO4)3 (aq)+ BaCl3
(aq) Al2Cl6 (aq)- +
3BaSO4(s) . What is the...
asked 10 months ago -
Suppose that Savneet is considering increasing her
recent random sample from 20 car rentals to 40...
asked 10 months ago -
Trucks arrive at an unloading terminal at an average rate of 120
per hour.
Trucks arrive...
asked 10 months ago -
Why are methanol and ethanol completely soluble in water while
octanol is not very little soluble....
asked 10 months ago -
A facilities manager at a university reads in a research report
that the mean amount of...
asked 10 months ago -
When the CuSO4 is rehydrated by adding water to the anhydrous
compound, is this an endothermic...
asked 10 months ago -
A ray of sunlight is passing from diamond into crown glass; the
angle of incidence is...
asked 10 months ago -
A block of mass 0.249 kg is placed on top of a light, vertical
spring of...
asked 10 months ago -
how do the kidneys compensate in the presences of acidosis
a) trigger hyperventilate
b) reserve acid...
asked 10 months ago -
Question 501 pts
The rental rate of capital to the firm increases. Which of the
following...
asked 10 months ago