4. A project has the following tasks and duration estimates given. These three tasks are done...
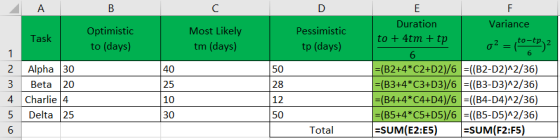
4. A project has the following tasks and duration estimates given. These three tasks are done in succession on a project. Task Optimistic Estimate Most Likely Estimate Pessimistic Estimate Alpha 30 days 40 days 50 days Beta 20 days 25 days 28 days Charlie 4 days 10 days 12 days Delta 25 days 30 days 50 days
a. What is the expected duration for the project? (3 points)
b. What is the variance for the project? (3 points) .
c. What is the standard deviation of the project? (3 points)
d. What is the range of the duration of the project given 3 sigma? (3 points)
Homework Answers
Based on the given data, we tabulate as shown below:

Based on above,
a. The expected duration for the project

As seen from above, the expected duration of the project is 106.5 days
The above table in form of formulas is shown below for better understanding and reference:

b. The variance for the project

As seen from above, the expected duration of the project is 32.03 days
The above table in form of formulas is shown below for better understanding and reference:
c. The standard deviation of the project
Standard Deviation of the project  =
=  =
=  = 5.66
d. The range of the duration of the project given 3 sigma
For 3 sigma, the probability = 99.87%
For probability = 99.87%, z value = 0.9987

0.9987 = 
Required Duration = 112.15 days
Add Answer to:
4. A project has the following tasks and duration estimates
given. These three tasks are done...
Project task E has the following estimates: (1) optimistic time - 10 days, (2) Pessimistic time...
 Project task E has the following estimates: (1) optimistic time - 10 days, (2) Pessimistic time - 20 days, and (3) Most likely time - 12 Days. The standard deviation for time using the beta statistical distribution is ________ days. 2.33 1.5 02 1.67
5. A project has critical path activities A, B, and C. A is the predecessor of B. B is the predec...
 5. A project has critical path activities A, B, and C. A is the predecessor of B. B is the predecessor of C. The duration estimate for activity A, B and C is shown in the following table. Fill the table with mean duration, standard deviation, and variance for activities and the whole project (critical path). Determine what is the probability of completing this project within 80 days? (10 points) Activity Optimistic Pessimistic Most likely Mean Standard Variance deviation duration...
Consider the following project, all durations are in days. Find the critical path and which tasks...
Consider the following project, all durations are in days. Find the critical path and which tasks have slack. What is the probability the project will be done in 50 days? How about in 53 days? Suppose any task can be crashed for up to two days for the same cost per day, but that tasks A and N cannot be crashed at all. Which tasks should be crashed if the project needed to be completed in 45 days with at...
It was determined on the following project that the duration for the tasks contained some uncertainty....
 It was determined on the following project that the duration for the tasks contained some uncertainty. After more research, the optimistic and pessimistic values were determined. 1. a. Calculate the expected time and variance (using the 95 percent level of confidence) for each activity. b. Determine the critical path and time for completion c. Calculate the probably that the project will finish in 30 days. Calculate the probably of completing the project in 27 days. Other than the critical path,...
The table below gives the optimistic, most-likely, and pessimistic time estimates (in weeks) for all activities in a project. (Statistical tables are available in appendix I) Activ Predecessor totm t...
 The table below gives the optimistic, most-likely, and pessimistic time estimates (in weeks) for all activities in a project. (Statistical tables are available in appendix I) Activ Predecessor totm t 2.0 5.0 8.0 3.0 4.0 5.0 4.06.08.0 5.0 6.0 7.0 3.0 6.0 9.0 D, E (i) Calculate the estimated time and variance for each task (ii) Draw the AON diagram and identify the critical path. (iii) What is the expected critical path duration and estimate a standard deviation for the...
(Ch 12) Assume that a task in a project has the following three time estimates: Optimistic...
(Ch 12) Assume that a task in a project has the following three time estimates: Optimistic completion time = 10 weeks Most likely completion time = 14 weeks Pessimistic completion time = 21 weeks Compute the estimated task completion time for this task.
Given the following information about a small project, Task Duration Immediate Estimates Predecessors A &n
Given the following information about a small project, Task Duration Immediate Estimates Predecessors A 2 days None B 5 days A C 4 days B D 9 days A E 4 days B & D F 12 days E & C Draw a network diagram. Identify the critical path, earliest start and finish and slack for each task. Using MS Excel, produce a Gantt chart for this project. What would happen if a new estimate for task D increases...
T 10.4-3. Reconsider Prob. 10.4-2. For each of the 10 activities, here are the three estimates that led to the esti...
 T 10.4-3. Reconsider Prob. 10.4-2. For each of the 10 activities, here are the three estimates that led to the estimates of the mean and variance of the duration of the activity (rounded to the near- est integer) given in the table for Prob. 10.4-2. Optimistic Most L Estimate Pessimistic Activity Estimate Estimate 1.5 months 2 months 3.5 months 1 month 15 months 2 months 21 months 18 months 1.5 months 15 months 0.5 month 1 month 3 months 1...
If the contracted duration for a project with the following network is 120 days, what is the prob...
 If the contracted duration for a project with the following
network is 120 days, what is the probability (in percent) of
meeting the schedule based on PERT analysis? Then, assume that the
owner delays the start by 5 days while keeping the end date as
originally scheduled. What is the probability (in percent) that the
project will still finish at the originally scheduled completion
date? The requested probabilities should be determined based on the
entire network and not just one...
If the contracted duration for a project with the following
network is 120 days, what is the probability (in percent) of
meeting the schedule based on PERT analysis? Then, assume that the
owner delays the start by 5 days while keeping the end date as
originally scheduled. What is the probability (in percent) that the
project will still finish at the originally scheduled completion
date? The requested probabilities should be determined based on the
entire network and not just one...
#1 #2 #3 #4 Time Estimates (in weeks) for SOM's Bus Project is given in the...
 #1
#2
#3
#4
Time Estimates (in weeks) for SOM's Bus Project is given in the following table. Activity Optimistic time Most likely time Pessimistic time A 2 4 6 B 3 5 8 Ic с 4 6 8 D 3 5 10 Please help the project management team to find the standard deviation of Activity D. keep two decimals if not exact, either round up or down is ok. For example, for 0.1346, (0.13 or 13) and (0.14 or.14)...
#1
#2
#3
#4
Time Estimates (in weeks) for SOM's Bus Project is given in the following table. Activity Optimistic time Most likely time Pessimistic time A 2 4 6 B 3 5 8 Ic с 4 6 8 D 3 5 10 Please help the project management team to find the standard deviation of Activity D. keep two decimals if not exact, either round up or down is ok. For example, for 0.1346, (0.13 or 13) and (0.14 or.14)...
 Project task E has the following estimates: (1) optimistic time - 10 days, (2) Pessimistic time - 20 days, and (3) Most likely time - 12 Days. The standard deviation for time using the beta statistical distribution is ________ days. 2.33 1.5 02 1.67
 5. A project has critical path activities A, B, and C. A is the predecessor of B. B is the predecessor of C. The duration estimate for activity A, B and C is shown in the following table. Fill the table with mean duration, standard deviation, and variance for activities and the whole project (critical path). Determine what is the probability of completing this project within 80 days? (10 points) Activity Optimistic Pessimistic Most likely Mean Standard Variance deviation duration...
 It was determined on the following project that the duration for the tasks contained some uncertainty. After more research, the optimistic and pessimistic values were determined. 1. a. Calculate the expected time and variance (using the 95 percent level of confidence) for each activity. b. Determine the critical path and time for completion c. Calculate the probably that the project will finish in 30 days. Calculate the probably of completing the project in 27 days. Other than the critical path,...
 The table below gives the optimistic, most-likely, and pessimistic time estimates (in weeks) for all activities in a project. (Statistical tables are available in appendix I) Activ Predecessor totm t 2.0 5.0 8.0 3.0 4.0 5.0 4.06.08.0 5.0 6.0 7.0 3.0 6.0 9.0 D, E (i) Calculate the estimated time and variance for each task (ii) Draw the AON diagram and identify the critical path. (iii) What is the expected critical path duration and estimate a standard deviation for the...
 T 10.4-3. Reconsider Prob. 10.4-2. For each of the 10 activities, here are the three estimates that led to the estimates of the mean and variance of the duration of the activity (rounded to the near- est integer) given in the table for Prob. 10.4-2. Optimistic Most L Estimate Pessimistic Activity Estimate Estimate 1.5 months 2 months 3.5 months 1 month 15 months 2 months 21 months 18 months 1.5 months 15 months 0.5 month 1 month 3 months 1...
 If the contracted duration for a project with the following
network is 120 days, what is the probability (in percent) of
meeting the schedule based on PERT analysis? Then, assume that the
owner delays the start by 5 days while keeping the end date as
originally scheduled. What is the probability (in percent) that the
project will still finish at the originally scheduled completion
date? The requested probabilities should be determined based on the
entire network and not just one...
If the contracted duration for a project with the following
network is 120 days, what is the probability (in percent) of
meeting the schedule based on PERT analysis? Then, assume that the
owner delays the start by 5 days while keeping the end date as
originally scheduled. What is the probability (in percent) that the
project will still finish at the originally scheduled completion
date? The requested probabilities should be determined based on the
entire network and not just one...
 #1
#2
#3
#4
Time Estimates (in weeks) for SOM's Bus Project is given in the following table. Activity Optimistic time Most likely time Pessimistic time A 2 4 6 B 3 5 8 Ic с 4 6 8 D 3 5 10 Please help the project management team to find the standard deviation of Activity D. keep two decimals if not exact, either round up or down is ok. For example, for 0.1346, (0.13 or 13) and (0.14 or.14)...
#1
#2
#3
#4
Time Estimates (in weeks) for SOM's Bus Project is given in the following table. Activity Optimistic time Most likely time Pessimistic time A 2 4 6 B 3 5 8 Ic с 4 6 8 D 3 5 10 Please help the project management team to find the standard deviation of Activity D. keep two decimals if not exact, either round up or down is ok. For example, for 0.1346, (0.13 or 13) and (0.14 or.14)...
Most questions answered within 3 hours.
-
Where is the error in this code sequence?
String s1 = "Hello";
String s2 = "ello";...
asked 10 months ago -
Financial data for Joel de Paris, Inc., for last year
follow:
Joel de Paris, Inc.
Balance...
asked 10 months ago -
Consider this reaction:
Al2(SO4)3 (aq)+ BaCl3
(aq) Al2Cl6 (aq)- +
3BaSO4(s) . What is the...
asked 10 months ago -
Suppose that Savneet is considering increasing her
recent random sample from 20 car rentals to 40...
asked 10 months ago -
Trucks arrive at an unloading terminal at an average rate of 120
per hour.
Trucks arrive...
asked 10 months ago -
Why are methanol and ethanol completely soluble in water while
octanol is not very little soluble....
asked 10 months ago -
A facilities manager at a university reads in a research report
that the mean amount of...
asked 10 months ago -
When the CuSO4 is rehydrated by adding water to the anhydrous
compound, is this an endothermic...
asked 10 months ago -
A ray of sunlight is passing from diamond into crown glass; the
angle of incidence is...
asked 10 months ago -
A block of mass 0.249 kg is placed on top of a light, vertical
spring of...
asked 10 months ago -
how do the kidneys compensate in the presences of acidosis
a) trigger hyperventilate
b) reserve acid...
asked 10 months ago -
Question 501 pts
The rental rate of capital to the firm increases. Which of the
following...
asked 10 months ago