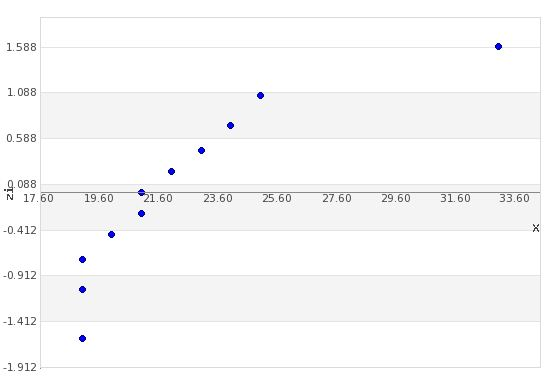
A random sample of 11 students provided the following age data: 25 19 20 21 19...
A random sample of 11 students provided the following age data: 25 19 20 21 19 23 22 19 33 21 24
Find the z-score for data value . (Round your answer to three decimal places.)
Homework Answers
From the given data :
19,19,19,20,21,21,22,23,24,25,33
sample mean(xbar)= xi/n=246/11=22.3636
Sample standard deviation(S)= (xi-xbar)/(n-1)=
 [(19-22.3636)^2+...+(33-22.3636)^2]/(11-1))=4.081
Now Z score =(x,-xbar)/s

Add Answer to:
A random sample of 11 students provided the following age data:
25 19 20 21 19...
A random sample of 16 pharmacy customers showed the waiting times below (in minutes). 11 25...
A random sample of 16 pharmacy customers showed the waiting times below (in minutes). 11 25 19 17 24 16 18 20 19 23 21 17 17 14 15 11 Click here for the Excel Data File Find a 90 percent confidence interval for μ, assuming that the sample is from a normal population. (Round your standard deviation answer to 4 decimal places and t-value to 3 decimal places. Round your answers to 3 decimal places.) The 90% confidence interval...
s. QUESTION 2 Use minitab Suppose a sample of 20 students were given a diagnostic test...
 s.
QUESTION 2 Use minitab Suppose a sample of 20 students were given a diagnostic test before studying a particular module and then again after completing the module. We want to find out if, in general, our teaching leads to improvements in students' knowledge/skills (i.e. test scores). We can use the results from our sample of students to draw conclusions about the impact of this module in general. 92.MPJ 1) check assumption (fort show your correct 3) find the t-value...
s.
QUESTION 2 Use minitab Suppose a sample of 20 students were given a diagnostic test before studying a particular module and then again after completing the module. We want to find out if, in general, our teaching leads to improvements in students' knowledge/skills (i.e. test scores). We can use the results from our sample of students to draw conclusions about the impact of this module in general. 92.MPJ 1) check assumption (fort show your correct 3) find the t-value...
Lecture19: Problem 11 Previous Problem List Next (1 point) The following data represents the number of days a rando...
 Lecture19: Problem 11 Previous Problem List Next (1 point) The following data represents the number of days a random sample of patients spent in the hospital after being admitted with a dangerous virus. 20 22 22 19 22 25 21 21 24 23 Assuming that the number of days in the hospital is normally distributed, find a 90 % confidence interval for the population mean based on this sample. Give the end points of your interval to three decimal places.
It is believed that the average age students is 26. Using a 0.05 level of significance,...
It is believed that the average age students is 26. Using a 0.05 level of significance, should the findings of the Class Survey support the belief that the average age is 26. The population standard deviation is 6.5. data set:(age) 31 30 21 20 44 43 23 25 30 28 19 21 21 37 26 20 19 22 28 40 20 48 19 20 36 20 20 19 19 21 47 19 21 19 17 19 20 20 32 23...
A random sample of 31 students at a community college showed an average age of 25...
 A random sample of 31 students at a community college showed an average age of 25 years. Assume the ages of all students at the college are normally distributed with a standard deviation of 1.8 years The 98% confidence interval for the average age of all students at this college is (Round your answers to 3 decimal places.) 1 Point Answer From 24.248 To 25.752
The SAT and the ACT are the two major standardized tests that colleges use to evaluate candidates. Most students take ju...
The SAT and the ACT are the two major standardized tests that colleges use to evaluate candidates. Most students take just one of these tests. However, some students take both. The data data42.datgives the scores of 60 students who did this. How can we relate the two tests? (a) Plot the data with SAT on the x axis and ACT on the y axis. Describe the overall pattern and any unusual observations. (b) Find the least-squares regression line and draw...
Sample Data Sample Data Hour Sample Taken Hour Sample Taken 1 4 5 X 1 3...
 Sample Data Sample Data Hour Sample Taken Hour Sample Taken 1 4 5 X 1 3 1 42 2 3 4 5 6 2 39 36 25 60 28 53 22 56 41 34 43 45 59 42 36 40 45 39 48 26 42 34 61 48 45 29 3 31 61 38 40 54 26 38 42 37 41 53 37 47 41 37 29 20 26 43 38 33 37 37 35 33 36 41 25 37...
4. The following frequency table shows the test score distribution for a random sample of 25...
 4. The following frequency table shows the test score distribution for a random sample of 25 students taking an introductory statistics class at a certain college. a. Find the missing relative frequency b. How many students in the sample RelativeF 0.08 0.04 Score 30-40 41-51 52-62 63-73 74 -84 85-95 had a score of at least 63? Total number of students taking an introductory statistics class at this college is 800. Based on the sample data above, estimate the total...
Consider the following data. 14 21 23 20 16 19 22 26 15 16 23 25...
Consider the following data. 14 21 23 20 16 19 22 26 15 16 23 25 24 20 15 20 19 20 21 13 17 17 18 23 26 21 22 15 20 18 25 24 15 23 25 19 21 24 21 19 (a) Develop a frequency distribution using classes of 12–14, 15–17, 18–20, 21–23, and 24–26. Class Frequency 12–14 15–17 18–20 21–23 24–26 Total (b) Develop a relative frequency distribution and a percent frequency distribution using the classes...
 s.
QUESTION 2 Use minitab Suppose a sample of 20 students were given a diagnostic test before studying a particular module and then again after completing the module. We want to find out if, in general, our teaching leads to improvements in students' knowledge/skills (i.e. test scores). We can use the results from our sample of students to draw conclusions about the impact of this module in general. 92.MPJ 1) check assumption (fort show your correct 3) find the t-value...
s.
QUESTION 2 Use minitab Suppose a sample of 20 students were given a diagnostic test before studying a particular module and then again after completing the module. We want to find out if, in general, our teaching leads to improvements in students' knowledge/skills (i.e. test scores). We can use the results from our sample of students to draw conclusions about the impact of this module in general. 92.MPJ 1) check assumption (fort show your correct 3) find the t-value...
 Lecture19: Problem 11 Previous Problem List Next (1 point) The following data represents the number of days a random sample of patients spent in the hospital after being admitted with a dangerous virus. 20 22 22 19 22 25 21 21 24 23 Assuming that the number of days in the hospital is normally distributed, find a 90 % confidence interval for the population mean based on this sample. Give the end points of your interval to three decimal places.
 A random sample of 31 students at a community college showed an average age of 25 years. Assume the ages of all students at the college are normally distributed with a standard deviation of 1.8 years The 98% confidence interval for the average age of all students at this college is (Round your answers to 3 decimal places.) 1 Point Answer From 24.248 To 25.752
 Sample Data Sample Data Hour Sample Taken Hour Sample Taken 1 4 5 X 1 3 1 42 2 3 4 5 6 2 39 36 25 60 28 53 22 56 41 34 43 45 59 42 36 40 45 39 48 26 42 34 61 48 45 29 3 31 61 38 40 54 26 38 42 37 41 53 37 47 41 37 29 20 26 43 38 33 37 37 35 33 36 41 25 37...
 4. The following frequency table shows the test score distribution for a random sample of 25 students taking an introductory statistics class at a certain college. a. Find the missing relative frequency b. How many students in the sample RelativeF 0.08 0.04 Score 30-40 41-51 52-62 63-73 74 -84 85-95 had a score of at least 63? Total number of students taking an introductory statistics class at this college is 800. Based on the sample data above, estimate the total...
Most questions answered within 3 hours.
-
Where is the error in this code sequence?
String s1 = "Hello";
String s2 = "ello";...
asked 10 months ago -
Financial data for Joel de Paris, Inc., for last year
follow:
Joel de Paris, Inc.
Balance...
asked 10 months ago -
Consider this reaction:
Al2(SO4)3 (aq)+ BaCl3
(aq) Al2Cl6 (aq)- +
3BaSO4(s) . What is the...
asked 10 months ago -
Suppose that Savneet is considering increasing her
recent random sample from 20 car rentals to 40...
asked 10 months ago -
Trucks arrive at an unloading terminal at an average rate of 120
per hour.
Trucks arrive...
asked 10 months ago -
Why are methanol and ethanol completely soluble in water while
octanol is not very little soluble....
asked 10 months ago -
A facilities manager at a university reads in a research report
that the mean amount of...
asked 10 months ago -
When the CuSO4 is rehydrated by adding water to the anhydrous
compound, is this an endothermic...
asked 10 months ago -
A ray of sunlight is passing from diamond into crown glass; the
angle of incidence is...
asked 10 months ago -
A block of mass 0.249 kg is placed on top of a light, vertical
spring of...
asked 10 months ago -
how do the kidneys compensate in the presences of acidosis
a) trigger hyperventilate
b) reserve acid...
asked 10 months ago -
Question 501 pts
The rental rate of capital to the firm increases. Which of the
following...
asked 10 months ago