Consider the following data: x : -7, -5, -1, 0, 2, 5, 6, .y: 15, 12...
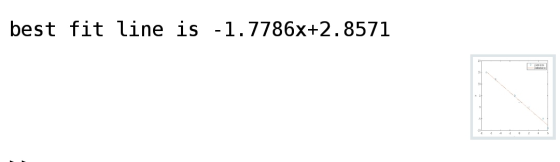
Consider the following data: x : -7, -5, -1, 0, 2, 5, 6, .y: 15, 12 ,5, 2, 0, -5, -9. Using linear regression find the equation in the form y=mx+b. b) Check your results for the coefficients in the trial function using a built-in function in Matlab, Python, or Mathematica. c) Plot the data points as dots and the best-fit line as a solid line on the same figure.
Homework Answers

MatLab program
clear all
clc
close all
% given data
x=[-7 -5 -1 0 2 5 6];
y=[15 12 5 2 0 -5 -9];
% fitting
p=polyfit(x,y,1);
m=p(1);
c=p(2);
% fitted data
x1=x;
y1=m*x1+c;
plot(x,y,'o',x1,y1)
xlabel('x');
ylabel('y');
legend('given data','plotted data')
fprintf('best fit line is %.4fx+%.4f',m,c);
Screenshot

Save the above program and execute it.
Result

I hope this will help you.
Add Answer to:
Consider the following data: x : -7, -5, -1, 0, 2, 5, 6, .y: 15,
12...
Using MATLAB, The following data is given: 13 14 15 15 2 10 12 (a) Use...
 Using MATLAB,
The following data is given: 13 14 15 15 2 10 12 (a) Use linear least-squares regression to determine the coefficients m and b in the function y - mx+b that best fits the data (b) Make a plot that shows the function and the data points.
Using MATLAB,
The following data is given: 13 14 15 15 2 10 12 (a) Use linear least-squares regression to determine the coefficients m and b in the function y - mx+b that best fits the data (b) Make a plot that shows the function and the data points.
please solve using matlab 4. Nonlinear Regression Fit the below data with the following curve-fit equation y bi (ebr + 2 1.0000 1.5431 3.7622 10.0677 27.3082 Define a function of the sum of squar...
 please solve using matlab
4. Nonlinear Regression Fit the below data with the following curve-fit equation y bi (ebr + 2 1.0000 1.5431 3.7622 10.0677 27.3082 Define a function of the sum of squared residuals (fSSR) as a function of the regression coefficients, b's. Minimize the fSSR function and determine the regression coefficients. Guess what would be the built-in math function to generate the original data? Plot the function in the existing figure with a smooth dashed line, calculate the...
please solve using matlab
4. Nonlinear Regression Fit the below data with the following curve-fit equation y bi (ebr + 2 1.0000 1.5431 3.7622 10.0677 27.3082 Define a function of the sum of squared residuals (fSSR) as a function of the regression coefficients, b's. Minimize the fSSR function and determine the regression coefficients. Guess what would be the built-in math function to generate the original data? Plot the function in the existing figure with a smooth dashed line, calculate the...
I need help with parts A B D E and F. Please show hand work for...
 I need help with parts A B D E and F. Please show hand work
for solving A and B while D and E should be matlab codes. How do i
pick the right graph for part F?
5 2 4 6 Linear spline: s fi+ (x-x) 2) Given the points 40 78 125 256 348 425 X1-x a) Write the correct linear spline equation to interpolate for x 4.72, simplifying where appropriate to get to the slope-intercept form. (4...
I need help with parts A B D E and F. Please show hand work
for solving A and B while D and E should be matlab codes. How do i
pick the right graph for part F?
5 2 4 6 Linear spline: s fi+ (x-x) 2) Given the points 40 78 125 256 348 425 X1-x a) Write the correct linear spline equation to interpolate for x 4.72, simplifying where appropriate to get to the slope-intercept form. (4...
Probability and Statistics 1. Linear Regression Given 4 data points: X Y 5 15 Use simple...
 Probability and Statistics
1. Linear Regression Given 4 data points: X Y 5 15 Use simple linear regression to estimate ßo and ß, for the best-fit line ỹ ß0 + ßqx Calculate these values: x | 7 | S | Spy | Bo | Big Sketch the regression line and the data points below
Probability and Statistics
1. Linear Regression Given 4 data points: X Y 5 15 Use simple linear regression to estimate ßo and ß, for the best-fit line ỹ ß0 + ßqx Calculate these values: x | 7 | S | Spy | Bo | Big Sketch the regression line and the data points below
2. Suppose Y ~ Exp(a), which has pdf f(y)-1 exp(-y/a). (a) Use the following R code to generate data from the model Yi...
 2. Suppose Y ~ Exp(a), which has pdf f(y)-1 exp(-y/a). (a) Use the following R code to generate data from the model Yi ~ Exp(0.05/Xi), and provide the scatterplot of Y against X set.seed(123) n <- 500 <-rnorm (n, x 3, 1) Y <- rexp(n, X) (b) Fit the model Yi-Ao + Ax, + ε¡ using the lm function in R and provide a plot of the best fit line on the scatterplot of Y vs X, and the residual...
1. Use Cramer's rule to solve this system. X + 4z = 2 2x + y...
 1. Use Cramer's rule to solve this system. X + 4z = 2 2x + y -z= 1 X +z=-1 on 910 2. Given the data points (0,), (1,3), (2,5) use the equation y=f(x) = mx +b to find the least square solution for best line fit. a. Evaluate the equation using the data points to obtain four linear equations. b. Write the system in 10a in a matrix form Ax=b. durants bhonebnih 516 10 boer word c. Write the...
At times t = 1, 2, 3, 4, 5, and 6 seconds, data values yt =...
At times t = 1, 2, 3, 4, 5, and 6 seconds, data values yt = 3, 7, 17, 37, 82, and 182 are recorded. a.) Plot the data. (In MATLAB, after storing the t and y values in vectors, use plot(t,y,'o').) From this graph, do you think a linear, exponential, or power function is the best model for the data? b. Produce a semilog plot and use it to roughly estimate the growth rate k for a model of...
Example 1: Least Squares Fit to a Data Set by a Linear Function. Compute the coefficients of the ...
 Example 1: Least Squares Fit to a Data Set by a Linear Function. Compute the coefficients of the best linear least-squares fit to the following data. x2.4 3.6 3.64 4.7 5.3 y| 33.8 34.7 35.5 36.0 37.5 38.1 Plot both the linear function and the data points on the same axis system Solution We can solve the problem with the following MATLAB commands x[2.4;3.6; 3.6;4.1;4.7;5.3]; y-L33.8;34.7;35.5;36.0;37.5;38.1 X [ones ( size (x)),x); % build the matrix X for linear model %...
use matlab 6. You have a x-y relationship as follows 1 2 3 4 5 6 7 8 10 X 17.52 22.76 24.22 36.83 37.65 51.32 68.3...
 use
matlab
6. You have a x-y relationship as follows 1 2 3 4 5 6 7 8 10 X 17.52 22.76 24.22 36.83 37.65 51.32 68.35 74.59 4.382 1.787 7.757 3nd order polynomial to curve-fit this relationship, i.e. We want to use a yaaxax +a^x (8) (a) Determine the coefficients of the polynomial by solving the following equation a (9) y's az a, (b) Determine the coefficients of the polynomial by using function polyfit (c) Make a plot showing...
use
matlab
6. You have a x-y relationship as follows 1 2 3 4 5 6 7 8 10 X 17.52 22.76 24.22 36.83 37.65 51.32 68.35 74.59 4.382 1.787 7.757 3nd order polynomial to curve-fit this relationship, i.e. We want to use a yaaxax +a^x (8) (a) Determine the coefficients of the polynomial by solving the following equation a (9) y's az a, (b) Determine the coefficients of the polynomial by using function polyfit (c) Make a plot showing...
3. Consider the following data for two variables, x and y. 4 5 4 6 4...
 3. Consider the following data for two variables, x and y. 4 5 4 6 4 6 9 5 11 a. Does there appear to be a linear relationship between x and y? Explain. b. Develop the estimated regression equation relating x and y. c. Plot the standardized residuals versus g for the estimated regression equation developed in part (b). Do the model assumptions appear to be satisfied? Explain. d. Perform a logarithmic transformation on the dependent variable y. Develop...
 Using MATLAB,
The following data is given: 13 14 15 15 2 10 12 (a) Use linear least-squares regression to determine the coefficients m and b in the function y - mx+b that best fits the data (b) Make a plot that shows the function and the data points.
Using MATLAB,
The following data is given: 13 14 15 15 2 10 12 (a) Use linear least-squares regression to determine the coefficients m and b in the function y - mx+b that best fits the data (b) Make a plot that shows the function and the data points.
 please solve using matlab
4. Nonlinear Regression Fit the below data with the following curve-fit equation y bi (ebr + 2 1.0000 1.5431 3.7622 10.0677 27.3082 Define a function of the sum of squared residuals (fSSR) as a function of the regression coefficients, b's. Minimize the fSSR function and determine the regression coefficients. Guess what would be the built-in math function to generate the original data? Plot the function in the existing figure with a smooth dashed line, calculate the...
please solve using matlab
4. Nonlinear Regression Fit the below data with the following curve-fit equation y bi (ebr + 2 1.0000 1.5431 3.7622 10.0677 27.3082 Define a function of the sum of squared residuals (fSSR) as a function of the regression coefficients, b's. Minimize the fSSR function and determine the regression coefficients. Guess what would be the built-in math function to generate the original data? Plot the function in the existing figure with a smooth dashed line, calculate the...
 I need help with parts A B D E and F. Please show hand work
for solving A and B while D and E should be matlab codes. How do i
pick the right graph for part F?
5 2 4 6 Linear spline: s fi+ (x-x) 2) Given the points 40 78 125 256 348 425 X1-x a) Write the correct linear spline equation to interpolate for x 4.72, simplifying where appropriate to get to the slope-intercept form. (4...
I need help with parts A B D E and F. Please show hand work
for solving A and B while D and E should be matlab codes. How do i
pick the right graph for part F?
5 2 4 6 Linear spline: s fi+ (x-x) 2) Given the points 40 78 125 256 348 425 X1-x a) Write the correct linear spline equation to interpolate for x 4.72, simplifying where appropriate to get to the slope-intercept form. (4...
 Probability and Statistics
1. Linear Regression Given 4 data points: X Y 5 15 Use simple linear regression to estimate ßo and ß, for the best-fit line ỹ ß0 + ßqx Calculate these values: x | 7 | S | Spy | Bo | Big Sketch the regression line and the data points below
Probability and Statistics
1. Linear Regression Given 4 data points: X Y 5 15 Use simple linear regression to estimate ßo and ß, for the best-fit line ỹ ß0 + ßqx Calculate these values: x | 7 | S | Spy | Bo | Big Sketch the regression line and the data points below
 2. Suppose Y ~ Exp(a), which has pdf f(y)-1 exp(-y/a). (a) Use the following R code to generate data from the model Yi ~ Exp(0.05/Xi), and provide the scatterplot of Y against X set.seed(123) n <- 500 <-rnorm (n, x 3, 1) Y <- rexp(n, X) (b) Fit the model Yi-Ao + Ax, + ε¡ using the lm function in R and provide a plot of the best fit line on the scatterplot of Y vs X, and the residual...
 1. Use Cramer's rule to solve this system. X + 4z = 2 2x + y -z= 1 X +z=-1 on 910 2. Given the data points (0,), (1,3), (2,5) use the equation y=f(x) = mx +b to find the least square solution for best line fit. a. Evaluate the equation using the data points to obtain four linear equations. b. Write the system in 10a in a matrix form Ax=b. durants bhonebnih 516 10 boer word c. Write the...
 Example 1: Least Squares Fit to a Data Set by a Linear Function. Compute the coefficients of the best linear least-squares fit to the following data. x2.4 3.6 3.64 4.7 5.3 y| 33.8 34.7 35.5 36.0 37.5 38.1 Plot both the linear function and the data points on the same axis system Solution We can solve the problem with the following MATLAB commands x[2.4;3.6; 3.6;4.1;4.7;5.3]; y-L33.8;34.7;35.5;36.0;37.5;38.1 X [ones ( size (x)),x); % build the matrix X for linear model %...
 use
matlab
6. You have a x-y relationship as follows 1 2 3 4 5 6 7 8 10 X 17.52 22.76 24.22 36.83 37.65 51.32 68.35 74.59 4.382 1.787 7.757 3nd order polynomial to curve-fit this relationship, i.e. We want to use a yaaxax +a^x (8) (a) Determine the coefficients of the polynomial by solving the following equation a (9) y's az a, (b) Determine the coefficients of the polynomial by using function polyfit (c) Make a plot showing...
use
matlab
6. You have a x-y relationship as follows 1 2 3 4 5 6 7 8 10 X 17.52 22.76 24.22 36.83 37.65 51.32 68.35 74.59 4.382 1.787 7.757 3nd order polynomial to curve-fit this relationship, i.e. We want to use a yaaxax +a^x (8) (a) Determine the coefficients of the polynomial by solving the following equation a (9) y's az a, (b) Determine the coefficients of the polynomial by using function polyfit (c) Make a plot showing...
 3. Consider the following data for two variables, x and y. 4 5 4 6 4 6 9 5 11 a. Does there appear to be a linear relationship between x and y? Explain. b. Develop the estimated regression equation relating x and y. c. Plot the standardized residuals versus g for the estimated regression equation developed in part (b). Do the model assumptions appear to be satisfied? Explain. d. Perform a logarithmic transformation on the dependent variable y. Develop...
Most questions answered within 3 hours.
-
Where is the error in this code sequence?
String s1 = "Hello";
String s2 = "ello";...
asked 10 months ago -
Financial data for Joel de Paris, Inc., for last year
follow:
Joel de Paris, Inc.
Balance...
asked 10 months ago -
Consider this reaction:
Al2(SO4)3 (aq)+ BaCl3
(aq) Al2Cl6 (aq)- +
3BaSO4(s) . What is the...
asked 10 months ago -
Suppose that Savneet is considering increasing her
recent random sample from 20 car rentals to 40...
asked 10 months ago -
Trucks arrive at an unloading terminal at an average rate of 120
per hour.
Trucks arrive...
asked 10 months ago -
Why are methanol and ethanol completely soluble in water while
octanol is not very little soluble....
asked 10 months ago -
A facilities manager at a university reads in a research report
that the mean amount of...
asked 10 months ago -
When the CuSO4 is rehydrated by adding water to the anhydrous
compound, is this an endothermic...
asked 10 months ago -
A ray of sunlight is passing from diamond into crown glass; the
angle of incidence is...
asked 10 months ago -
A block of mass 0.249 kg is placed on top of a light, vertical
spring of...
asked 10 months ago -
how do the kidneys compensate in the presences of acidosis
a) trigger hyperventilate
b) reserve acid...
asked 10 months ago -
Question 501 pts
The rental rate of capital to the firm increases. Which of the
following...
asked 10 months ago