2. Assume a pharmaceutical company invented a drug that is more effective in treating (or at...
2. Assume a pharmaceutical company invented a drug that is more effective in treating (or at least life extending) blood cancers and managed to obtain a patent on the drug making the company the sole provider of this blood cancer drug in the market for the next 30 years. Assume in the long-run (i.e.,in 30 years) as the patent expires, given a perfectly elastic long-run supply in the long-run, the competitive price becomes Pc, which also represents the industry’s marginal cost (MC) and average cost (AC). Assume a typical downward sloping market demand curve and the corresponding marginal revenue curve likely to prevail in a market characterized by monopoly. (20points-each part 5 points)
a) Draw a diagram with P on the y-axis and Q on the x-axis for the market for this drug. Draw the demand curve and the corresponding marginal revenue curve. Show the industry (i.e. firm in the short-run) MC=AC=Pc (long-run competitive price) on the diagram. Show the long-run competitive quantity (Qc) on the diagram.
b) Show the monopolistic firm’s profit maximizing output level (Qm) and the corresponding price level (Pm) on the diagram drawn in part a. Show the area that represents the welfare loss from monopoly on the diagram drawn in part a. Explain why this area represents welfare loss.
c) Assume the government established a maximum price of Pr where Pm>Pr>Pc. Show the Qr, the output produced under this government regulation, on the diagram drawn in part a. Assuming no complications in interventions as in government failure, would this price control help reduce welfare loss? Why or why not?
d) Is there still welfare loss under price regulation with a price of Pr? If no, explain why not. If yes, show the area of welfare loss on the diagram drawn in part a and compare welfare loss under Pr to welfare loss under Pm.
Homework Answers
a. The long run competitive equilibrium is given by P=MC and the competitive price and quantity are shown below in the diagram.

b. The monopolist equilibrium is determined at MR=MC. monopolist profit maximizing price,Pm and quantity,Qm are shown in the diagram below. The welfare loss due to monopoly is shown by the area of triangle abc. This is because monopolist sells less quantity at a higher price as compared to the perfect competition.

c. When government sets the price ceiling at Pr, the corresponding output is Qr. This price control helps to reduce the welfare loss by area abed. This is because the Pr is lower than than Pm, while Qr is higher than Qm. Thus, consumers are now getting more quantity of drugs at a lower price.
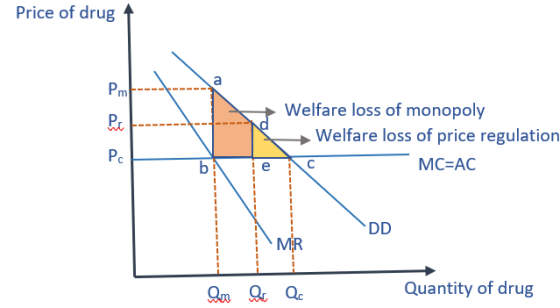
d. Even after price regulation,there is still welfare loss of area of triangle dec as shown in figure. This is because Pr is still higher than Pc and Qr is lower than Qc. Thus, consumers are paying more price for lesser quantity,resulting in loss of consumer surplus. At the competitive equilibrium,there is no welfare loss.
Add Answer to:
2. Assume a pharmaceutical company invented a drug that is more
effective in treating (or at...
A pharmaceutical company acquired a 10 year drug patent, making the company a monopolist in the...
A pharmaceutical company acquired a 10 year drug patent, making the company a monopolist in the corresponding market for this period. Suppose the marginal cost of producing the drug is zero and the demand curve has a downward slope and a positive intercept. (a) Plot the demand, marginal revenue and the marginal cost curves and show the quantity produced by the monopolist. (b) Suppose after the patent runs out, new firms enter the market for this particular drug and the...
A pharmaceutical company acquired a 10 year drug patent, making the company a monopolist in the...
 A pharmaceutical company acquired a 10 year drug patent, making the company a monopolist in the corresponding market for this period. Suppose the marginal cost of producing the drug is zero and the demand curve has a downward slope and a positive intercept. (a) Plot the demand, marginal revenue and the marginal cost curves and show the quantity produced by the monopolist. (b) Suppose after the patent runs out, new firms enter the market for this particular drug and the...
3. A pharmaceutical company acquired a 10 year drug patent, making the company a monopolist in the corresponding market...
 3. A pharmaceutical company acquired a 10 year drug patent, making the company a monopolist in the corresponding market for this period. Suppose the marginal cost of producing the drug is zero and the demand curve has a downward slope and a positive intercept. a) Plot the demand, marginal revenue and the marginal cost curves and show the quantity produced by the monopolist. (b) Suppose after the patent runs out, new firms enter the market for this particular drug and...
Assume that one of the hot dog vendors successfully lobbies the city council to obtain the...
 Assume that one of the hot dog vendors successfully lobbies the city council to obtain the exclusive right to sell hot dogs within the city limits. This firm buys up all the rest of the hot dog vendors in the city and operates as a monopoly. Assume that this change doesn't affect demand and that the new monopoly's marginal-cost curve corresponds exactly to the supply curve on the previous graph. Under this assumption, the following graph shows the demand (D),...
Answer these with thorough explanations, please! 5. Monopoly outcome versus competition outcome Consider the daily market...
 Answer these with thorough explanations, please!
5. Monopoly outcome versus competition outcome Consider the daily market for hot dogs in a small city. Suppose that this market is in long-run competitive equilibrium with many hot dog stands in city, each one selling the same kind of hot dogs. Therefore, each vendor is a price taker and possesses no market power. The following graph shows the demand (D) and supply (S = MC) curves in the market for hot dogs. Place...
Answer these with thorough explanations, please!
5. Monopoly outcome versus competition outcome Consider the daily market for hot dogs in a small city. Suppose that this market is in long-run competitive equilibrium with many hot dog stands in city, each one selling the same kind of hot dogs. Therefore, each vendor is a price taker and possesses no market power. The following graph shows the demand (D) and supply (S = MC) curves in the market for hot dogs. Place...
In many countries such as the US, when a pharmaceutical company discovers a new drug, it...
In many countries such as the US, when a pharmaceutical company discovers a new drug, it can apply to the government for a patent on the new drug. The patent gives the company the exclusive right to sell the new drug for a long period of time, such as 20 years. In other words, the pharmaceutical company is a monopolist in the market for the new drug. Suppose the market demand for the new drug is shown as below: Price...
Please explain in details with step by step solution, Thank you very much ) Assume a...
 Please explain in details with step by step solution, Thank you
very much
) Assume a monopolist faces a market demand curve P 100 - 2Q and has the short-run total cost function C 640+20Q. i) What is the profit-maximizing level of output? What is the profits? Graph the marginal revenue, marginal cost, and demand curves, and show the area that (7 Marks) In Question f (i), what would price and output be if the firm priced at socially represents...
Please explain in details with step by step solution, Thank you
very much
) Assume a monopolist faces a market demand curve P 100 - 2Q and has the short-run total cost function C 640+20Q. i) What is the profit-maximizing level of output? What is the profits? Graph the marginal revenue, marginal cost, and demand curves, and show the area that (7 Marks) In Question f (i), what would price and output be if the firm priced at socially represents...
The table below represents the demand curve for a cancer treatment drug in the fictional country...
The table below represents the demand curve for a cancer treatment drug in the fictional country of Frobia . Frobia is a small, low-income country with no public health care system. Few people are covered by insurance. The price is for a bottle that contains a one-month supply of the drug. Assume that one drug company, BigPharma, has a patent on this drug, and there are no close substitutes. BigPharma is the sole legal provider of this drug in Frobia....
4) The table below represents the demand curve for a cancer treatment drug in the fictional...
 4) The table below represents the demand curve for a cancer treatment drug in the fictional country of Frobia, Frobia is a small, low-income country with no public health care system. Few people are covered by insurance. The price is for a bottle that contains a one-month supply of the drug Assume that one drug company, BigPharma, has a patent on this drug, and there are no close substitutes. Big Pharma is the sole legal provider of this drug in...
Place the black point (plus symbol) on the following graph to indicate the profit- maximising price...
 Place the black point (plus symbol) on the following graph to indicate the profit- maximising price and quantity of a monopolist. 5. Monopoly outcome versus competition outcome Consider the daily market for hot dogs in a small city. Imagine that this market is in long-run competitive equilibrium with many hot dog stands in the city, each one selling the same kind of hot dogs. Therefore, each vendor is a price taker and possesses no market power Monopaly Outcome The following...
 A pharmaceutical company acquired a 10 year drug patent, making the company a monopolist in the corresponding market for this period. Suppose the marginal cost of producing the drug is zero and the demand curve has a downward slope and a positive intercept. (a) Plot the demand, marginal revenue and the marginal cost curves and show the quantity produced by the monopolist. (b) Suppose after the patent runs out, new firms enter the market for this particular drug and the...
 3. A pharmaceutical company acquired a 10 year drug patent, making the company a monopolist in the corresponding market for this period. Suppose the marginal cost of producing the drug is zero and the demand curve has a downward slope and a positive intercept. a) Plot the demand, marginal revenue and the marginal cost curves and show the quantity produced by the monopolist. (b) Suppose after the patent runs out, new firms enter the market for this particular drug and...
 Assume that one of the hot dog vendors successfully lobbies the city council to obtain the exclusive right to sell hot dogs within the city limits. This firm buys up all the rest of the hot dog vendors in the city and operates as a monopoly. Assume that this change doesn't affect demand and that the new monopoly's marginal-cost curve corresponds exactly to the supply curve on the previous graph. Under this assumption, the following graph shows the demand (D),...
 Answer these with thorough explanations, please!
5. Monopoly outcome versus competition outcome Consider the daily market for hot dogs in a small city. Suppose that this market is in long-run competitive equilibrium with many hot dog stands in city, each one selling the same kind of hot dogs. Therefore, each vendor is a price taker and possesses no market power. The following graph shows the demand (D) and supply (S = MC) curves in the market for hot dogs. Place...
Answer these with thorough explanations, please!
5. Monopoly outcome versus competition outcome Consider the daily market for hot dogs in a small city. Suppose that this market is in long-run competitive equilibrium with many hot dog stands in city, each one selling the same kind of hot dogs. Therefore, each vendor is a price taker and possesses no market power. The following graph shows the demand (D) and supply (S = MC) curves in the market for hot dogs. Place...
 Please explain in details with step by step solution, Thank you
very much
) Assume a monopolist faces a market demand curve P 100 - 2Q and has the short-run total cost function C 640+20Q. i) What is the profit-maximizing level of output? What is the profits? Graph the marginal revenue, marginal cost, and demand curves, and show the area that (7 Marks) In Question f (i), what would price and output be if the firm priced at socially represents...
Please explain in details with step by step solution, Thank you
very much
) Assume a monopolist faces a market demand curve P 100 - 2Q and has the short-run total cost function C 640+20Q. i) What is the profit-maximizing level of output? What is the profits? Graph the marginal revenue, marginal cost, and demand curves, and show the area that (7 Marks) In Question f (i), what would price and output be if the firm priced at socially represents...
 4) The table below represents the demand curve for a cancer treatment drug in the fictional country of Frobia, Frobia is a small, low-income country with no public health care system. Few people are covered by insurance. The price is for a bottle that contains a one-month supply of the drug Assume that one drug company, BigPharma, has a patent on this drug, and there are no close substitutes. Big Pharma is the sole legal provider of this drug in...
 Place the black point (plus symbol) on the following graph to indicate the profit- maximising price and quantity of a monopolist. 5. Monopoly outcome versus competition outcome Consider the daily market for hot dogs in a small city. Imagine that this market is in long-run competitive equilibrium with many hot dog stands in the city, each one selling the same kind of hot dogs. Therefore, each vendor is a price taker and possesses no market power Monopaly Outcome The following...
Most questions answered within 3 hours.
-
Where is the error in this code sequence?
String s1 = "Hello";
String s2 = "ello";...
asked 11 months ago -
Financial data for Joel de Paris, Inc., for last year
follow:
Joel de Paris, Inc.
Balance...
asked 11 months ago -
Consider this reaction:
Al2(SO4)3 (aq)+ BaCl3
(aq) Al2Cl6 (aq)- +
3BaSO4(s) . What is the...
asked 11 months ago -
Suppose that Savneet is considering increasing her
recent random sample from 20 car rentals to 40...
asked 11 months ago -
Trucks arrive at an unloading terminal at an average rate of 120
per hour.
Trucks arrive...
asked 11 months ago -
Why are methanol and ethanol completely soluble in water while
octanol is not very little soluble....
asked 11 months ago -
A facilities manager at a university reads in a research report
that the mean amount of...
asked 11 months ago -
When the CuSO4 is rehydrated by adding water to the anhydrous
compound, is this an endothermic...
asked 11 months ago -
A ray of sunlight is passing from diamond into crown glass; the
angle of incidence is...
asked 11 months ago -
A block of mass 0.249 kg is placed on top of a light, vertical
spring of...
asked 11 months ago -
how do the kidneys compensate in the presences of acidosis
a) trigger hyperventilate
b) reserve acid...
asked 11 months ago -
Question 501 pts
The rental rate of capital to the firm increases. Which of the
following...
asked 11 months ago