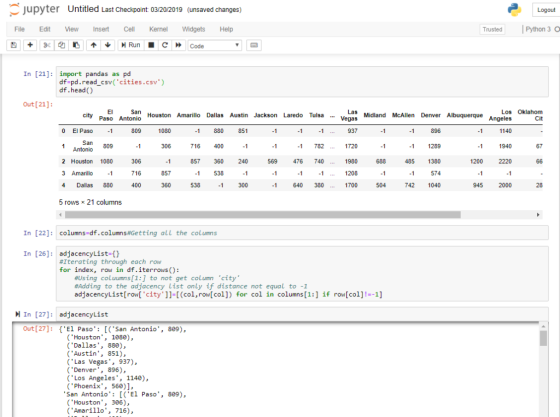
PYTHON 1.Convert CSV file to adjacency List only if a distance exists, if distance between cities...
PYTHON
1.Convert CSV file to adjacency List only if a distance exists, if distance between cities is -1 dont add
cities.csv(below)
city,El Paso,San
Antonio,Houston,Amarillo,Dallas,Austin,Jackson,Laredo,Tulsa,Lubbock,Las
Vegas,Midland,McAllen,Denver,Albuquerque,Los Angeles,Oklahoma
City,Phoenix,New Orleans,Wichita
El
Paso,-1,809,1080,-1,880,851,-1,-1,-1,-1,937,-1,-1,896,-1,1140,-1,560,-1,-1
San
Antonio,809,-1,306,716,400,-1,-1,-1,782,-1,1720,-1,-1,1289,-1,1940,676,1365,817,-1
Houston,1080,306,-1,857,360,240,569,476,740,740,1980,688,485,1380,1200,2220,664,1635,480,898
Amarillo,-1,716,857,-1,538,-1,-1,-1,-1,-1,1208,-1,-1,574,-1,-1,-1,962,-1,-1
Dallas,880,400,360,538,-1,300,-1,640,380,480,1700,504,742,1040,945,2000,280,1400,720,547
Austin,851,-1,240,-1,300,-1,-1,-1,673,535,1760,-1,-1,1240,991,1975,579,1400,740,-1
Jackson,-1,-1,569,-1,-1,-1,-1,-1,-1,-1,-1,-1,-1,1566,-1,-1,-1,-1,-1,-1
Laredo,-1,-1,476,-1,640,-1,-1,-1,-1,-1,2136,-1,-1,-1,-1,-1,-1,-1,-1,-1
Tulsa,-1,782,740,-1,380,673,-1,-1,-1,-1,1720,-1,-1,885,-1,2060,-1,1500,-1,-1
Lubbock,-1,-1,740,-1,480,535,-1,-1,-1,-1,1180,-1,-1,739,-1,-1,-1,949,-1,-1
Las
Vegas,937,1720,1980,1208,1700,1760,-1,2163,1720,1180,-1,1290,1949,1000,778,380,1580,412,2420,1580
Midland,-1,-1,688,-1,504,-1,-1,-1,-1,-1,1290,-1,-1,900,-1,-1,-1,950,-1,-1
McAllen,-1,-1,485,-1,742,-1,-1,-1,-1,-1,1949,-1,-1,-1,-1,1311,-1,-1,-1,-1
Denver,896,1289,1380,574,1040,1240,1566,-1,885,739,1000,900,-1,-1,537,1380,797,969,1709,675
Albuquerque,-1,-1,1200,-1,945,991,-1,-1,-1,-1,778,-1,-1,537,-1,1090,-1,529,-1,-1
Los
Angeles,1140,1940,2220,-1,2000,1975,-1,-1,2060,-1,380,-1,1311,1380,1090,-1,1901,575,2688,-1
Oklahoma
City,-1,676,664,-1,280,579,-1,-1,-1,-1,1580,-1,-1,797,-1,1901,-1,1352,-1,-1
Phoenix,560,1365,1635,962,1400,1400,-1,-1,15000,949,412,950,-1,969,529,575,1352,-1,2117,1875
New
Orleans,-1,817,480,-1,720,740,-1,-1,-1,-1,2420,-1,-1,1709,-1,2688,-1,2117,-1,-1
Wichita,-1,-1,898,-1,547,-1,-1,-1,-1,-1,1580,-1,-1,675,-1,-1,-1,1875,-1,-1
Homework Answers
#CODE
import pandas as pd
df=pd.read_csv('cities.csv')
df.head()
columns=df.columns#Getting all the columns
adjacencyList={}
#Iterating through each row
for index, row in df.iterrows():
#Using coluumns[1:] to not get column 'city'
#Adding to the adjacency list only if distance not equal to
-1
adjacencyList[row['city']]=[(col,row[col]) for col in columns[1:]
if row[col]!=-1]
adjacencyList
Add Answer to:
PYTHON
1.Convert CSV file to adjacency List only if a distance exists,
if distance between cities...
The average number of minutes Americans commute to work is 27.7 minutes (Sterling's Best Places, April...
 The average number of minutes Americans commute to work is 27.7 minutes (Sterling's Best Places, April 13, 2012). The average commute time in minutes for 48 cities are as follows: Click on the datafile logo to reference the data. DATA file Albuquerque Atlanta Austin Baltimore Boston Charlotte Chicago Cincinnati Cleveland Columbus Dallas Denver Detroit El Paso Fresno Indianapolis 23.3 28.3 24.6 32.1 31.7 25.8 38.1 24.9 26.8 23.4 28.5 28.1 29.3 24.4 23.0 24.8 Jacksonville Kansas City Las Vegas Little...
Why is L75 different than the Third Quartile? I can easily find 3rd Quartile using excel....
 Why is L75 different than the Third Quartile? I can easily find
3rd Quartile using excel. I'm not sure how to find L75 though?
Thank you!!
The average number of minutes Americans commute to work is 27.7 minutes (Sterling's Best Places, April 13, 2012). The average commute time in minutes for 48 cities are as follows: Click on the datafile logo to reference the data. DATA file Albuquerque 23.3 Jacksonville 26.2 Phoenix 28.3 Atlanta 28.3 Kansas City 23.4 Pittsburgh 25.0...
Why is L75 different than the Third Quartile? I can easily find
3rd Quartile using excel. I'm not sure how to find L75 though?
Thank you!!
The average number of minutes Americans commute to work is 27.7 minutes (Sterling's Best Places, April 13, 2012). The average commute time in minutes for 48 cities are as follows: Click on the datafile logo to reference the data. DATA file Albuquerque 23.3 Jacksonville 26.2 Phoenix 28.3 Atlanta 28.3 Kansas City 23.4 Pittsburgh 25.0...
QUESTION 9 How much time do Americans living in or near cities spend waiting in traffic,...
 QUESTION 9 How much time do Americans living in or near cities spend waiting in traffic, and how much does waiting in traffic cost them per year? The file here contains this cost for 30 cities. For the cost sitting in traffice, compute the balancing point, the value that occurs more than any other, the middle value, the standard deviation, skewness, kurtosis, coefficient of variation and range Balancing point The value that occurs more than any other = The middle...
Use this file to answer the following questions: 1. what is the p-value to test whether...
 Use this file to answer the following questions:
1. what is the p-value to test whether there is a significant
relationship between the variables?
2. Based on the estimated line, approximately what audit
percentage would you predict at an average gross income of
35000?
3. what average gross income is associated with an audit
percentage of 0.7?
4. what is the slope of the estimated regression line?
5. what is the coefficient of determination?
A B с 1 1 District...
Use this file to answer the following questions:
1. what is the p-value to test whether there is a significant
relationship between the variables?
2. Based on the estimated line, approximately what audit
percentage would you predict at an average gross income of
35000?
3. what average gross income is associated with an audit
percentage of 0.7?
4. what is the slope of the estimated regression line?
5. what is the coefficient of determination?
A B с 1 1 District...
Question 2: How do the average credit scores of people living in various cities in the...
Question 2: How do the average credit scores of people living in various cities in the US differ? The file Credit Score Data of 143 American cities is provided in Canvas. Construct a histogram Create a Five Summary Report Calculate Mean, Variance and Standard Deviation What conclusion can you reach concerning the average credit scores of people living in different American cities? City State Average Credit Score Detroit Mi 743 New York NY 762 Minneapolis MN 787 Hartford CT 774...
TravelAir.com samples domestic airline flights to explore the relationship between airfare and distance. The service would...
 TravelAir.com samples domestic airline flights to explore the relationship between airfare and distance. The service would like to know if there is a correlation between airfare and flight distance. If there is a correlation, what percentage of the variation in airfare is accounted for by distance? How much does each additional mile add to the fare? The data follow. Distance Fare 636 $109 2,395 252 2,176 221 605 151 403 138 1,258 209 254 627 259 264 2,342 215 177...
How does cellphone service compare between different cities? The data stored in CellService represent the rating...
 How does cellphone service compare between different cities? The data stored in CellService represent the rating of Verizon and AT&T in 22 different cities. (Data extracted from "Best Phones and Service," Consumer Reports, January 2012, p. 28, 37.) At the 0.05 level of significance, is there evidence of a difference in the mean cellphone service rating between Verizon and AT&T? You need to download "CellService” data file. End of document Le L show Queries ILS Prope Prope Refresh File Home...
Is there a relationship between total team salary and team performance in a sport such as...
Is there a relationship between total team salary and team performance in a sport such as professional basketball? To answer this question we will examine the number of wins and total team payroll in a recent season for all the teams in the National Basketball Association (NBA). The data are in this Excel file. Question 1. Let the x-variable be the team payroll and let the y-variable be the team wins. Find the intercept b0 and slope b1 of the...
CPS 276 DOC02-- Assignment 02 Cost of Living Calculator Your client maintains job search website. As...
 CPS 276 DOC02-- Assignment 02 Cost of Living Calculator Your
client maintains job search website. As a service on their website,
they need an application that compares costs of living between
different metropolitan areas. Client will pay $780 for a complete
application. Background Information: A person living in an area
with a high cost of living will need higher income to maintain the
same standard of living as someone living in an area with a low
cost of living. For...
CPS 276 DOC02-- Assignment 02 Cost of Living Calculator Your
client maintains job search website. As a service on their website,
they need an application that compares costs of living between
different metropolitan areas. Client will pay $780 for a complete
application. Background Information: A person living in an area
with a high cost of living will need higher income to maintain the
same standard of living as someone living in an area with a low
cost of living. For...
All teams have a goal to make the postseason playoffs. A basketball team thinks that it...
 All teams have a goal to make the postseason playoffs. A
basketball team thinks that it can make the playoffs next year if
it wins 10 more games. How much should the basketball team increase
its payroll if it wants to make the playoffs next year?
Note: Use 2 decimal places. Your answer should
be in units of $1 million; do NOT include a dollar sign in the
answer; for example, if a team should increase its payroll by
$5,250,000,...
All teams have a goal to make the postseason playoffs. A
basketball team thinks that it can make the playoffs next year if
it wins 10 more games. How much should the basketball team increase
its payroll if it wants to make the playoffs next year?
Note: Use 2 decimal places. Your answer should
be in units of $1 million; do NOT include a dollar sign in the
answer; for example, if a team should increase its payroll by
$5,250,000,...
 The average number of minutes Americans commute to work is 27.7 minutes (Sterling's Best Places, April 13, 2012). The average commute time in minutes for 48 cities are as follows: Click on the datafile logo to reference the data. DATA file Albuquerque Atlanta Austin Baltimore Boston Charlotte Chicago Cincinnati Cleveland Columbus Dallas Denver Detroit El Paso Fresno Indianapolis 23.3 28.3 24.6 32.1 31.7 25.8 38.1 24.9 26.8 23.4 28.5 28.1 29.3 24.4 23.0 24.8 Jacksonville Kansas City Las Vegas Little...
 Why is L75 different than the Third Quartile? I can easily find
3rd Quartile using excel. I'm not sure how to find L75 though?
Thank you!!
The average number of minutes Americans commute to work is 27.7 minutes (Sterling's Best Places, April 13, 2012). The average commute time in minutes for 48 cities are as follows: Click on the datafile logo to reference the data. DATA file Albuquerque 23.3 Jacksonville 26.2 Phoenix 28.3 Atlanta 28.3 Kansas City 23.4 Pittsburgh 25.0...
Why is L75 different than the Third Quartile? I can easily find
3rd Quartile using excel. I'm not sure how to find L75 though?
Thank you!!
The average number of minutes Americans commute to work is 27.7 minutes (Sterling's Best Places, April 13, 2012). The average commute time in minutes for 48 cities are as follows: Click on the datafile logo to reference the data. DATA file Albuquerque 23.3 Jacksonville 26.2 Phoenix 28.3 Atlanta 28.3 Kansas City 23.4 Pittsburgh 25.0...
 QUESTION 9 How much time do Americans living in or near cities spend waiting in traffic, and how much does waiting in traffic cost them per year? The file here contains this cost for 30 cities. For the cost sitting in traffice, compute the balancing point, the value that occurs more than any other, the middle value, the standard deviation, skewness, kurtosis, coefficient of variation and range Balancing point The value that occurs more than any other = The middle...
 Use this file to answer the following questions:
1. what is the p-value to test whether there is a significant
relationship between the variables?
2. Based on the estimated line, approximately what audit
percentage would you predict at an average gross income of
35000?
3. what average gross income is associated with an audit
percentage of 0.7?
4. what is the slope of the estimated regression line?
5. what is the coefficient of determination?
A B с 1 1 District...
Use this file to answer the following questions:
1. what is the p-value to test whether there is a significant
relationship between the variables?
2. Based on the estimated line, approximately what audit
percentage would you predict at an average gross income of
35000?
3. what average gross income is associated with an audit
percentage of 0.7?
4. what is the slope of the estimated regression line?
5. what is the coefficient of determination?
A B с 1 1 District...
 TravelAir.com samples domestic airline flights to explore the relationship between airfare and distance. The service would like to know if there is a correlation between airfare and flight distance. If there is a correlation, what percentage of the variation in airfare is accounted for by distance? How much does each additional mile add to the fare? The data follow. Distance Fare 636 $109 2,395 252 2,176 221 605 151 403 138 1,258 209 254 627 259 264 2,342 215 177...
 How does cellphone service compare between different cities? The data stored in CellService represent the rating of Verizon and AT&T in 22 different cities. (Data extracted from "Best Phones and Service," Consumer Reports, January 2012, p. 28, 37.) At the 0.05 level of significance, is there evidence of a difference in the mean cellphone service rating between Verizon and AT&T? You need to download "CellService” data file. End of document Le L show Queries ILS Prope Prope Refresh File Home...
 CPS 276 DOC02-- Assignment 02 Cost of Living Calculator Your
client maintains job search website. As a service on their website,
they need an application that compares costs of living between
different metropolitan areas. Client will pay $780 for a complete
application. Background Information: A person living in an area
with a high cost of living will need higher income to maintain the
same standard of living as someone living in an area with a low
cost of living. For...
CPS 276 DOC02-- Assignment 02 Cost of Living Calculator Your
client maintains job search website. As a service on their website,
they need an application that compares costs of living between
different metropolitan areas. Client will pay $780 for a complete
application. Background Information: A person living in an area
with a high cost of living will need higher income to maintain the
same standard of living as someone living in an area with a low
cost of living. For...
 All teams have a goal to make the postseason playoffs. A
basketball team thinks that it can make the playoffs next year if
it wins 10 more games. How much should the basketball team increase
its payroll if it wants to make the playoffs next year?
Note: Use 2 decimal places. Your answer should
be in units of $1 million; do NOT include a dollar sign in the
answer; for example, if a team should increase its payroll by
$5,250,000,...
All teams have a goal to make the postseason playoffs. A
basketball team thinks that it can make the playoffs next year if
it wins 10 more games. How much should the basketball team increase
its payroll if it wants to make the playoffs next year?
Note: Use 2 decimal places. Your answer should
be in units of $1 million; do NOT include a dollar sign in the
answer; for example, if a team should increase its payroll by
$5,250,000,...
Most questions answered within 3 hours.
-
Where is the error in this code sequence?
String s1 = "Hello";
String s2 = "ello";...
asked 10 months ago -
Financial data for Joel de Paris, Inc., for last year
follow:
Joel de Paris, Inc.
Balance...
asked 10 months ago -
Consider this reaction:
Al2(SO4)3 (aq)+ BaCl3
(aq) Al2Cl6 (aq)- +
3BaSO4(s) . What is the...
asked 10 months ago -
Suppose that Savneet is considering increasing her
recent random sample from 20 car rentals to 40...
asked 10 months ago -
Trucks arrive at an unloading terminal at an average rate of 120
per hour.
Trucks arrive...
asked 10 months ago -
Why are methanol and ethanol completely soluble in water while
octanol is not very little soluble....
asked 10 months ago -
A facilities manager at a university reads in a research report
that the mean amount of...
asked 10 months ago -
When the CuSO4 is rehydrated by adding water to the anhydrous
compound, is this an endothermic...
asked 10 months ago -
A ray of sunlight is passing from diamond into crown glass; the
angle of incidence is...
asked 10 months ago -
A block of mass 0.249 kg is placed on top of a light, vertical
spring of...
asked 10 months ago -
how do the kidneys compensate in the presences of acidosis
a) trigger hyperventilate
b) reserve acid...
asked 10 months ago -
Question 501 pts
The rental rate of capital to the firm increases. Which of the
following...
asked 10 months ago