Consider the following competing hypotheses: (You may find it useful to reference the appropriate table: z...
Consider the following competing hypotheses: (You may
find it useful to reference the appropriate table: z table
or t table)
H0: μD ≥ 0;
HA: μD < 0
d¯d¯ = −3.2, sD = 6.0, n =
23
The following results are obtained using matched samples from two
normally distributed populations:
a-1. Calculate the value of the test statistic,
assuming that the sample difference is normally distributed.
(Negative value should be indicated by a minus sign. Round
intermediate calculations to at least 4 decimal places and final
answer to 2 decimal places.)
a-2. Find the p-value.
- 0.025 p value < 0.05
- 0.05 p value < 0.10
- p value 0.10
-
p value < 0.01
- 0.01 p value < 0.025
b. At the 5% significance level, what is the
conclusion to the hypothesis test?
-
Do not reject H0 since the p value is greater than the significance level.
-
Reject H0 since the p value is greater than the significance level.
-
Do not reject H0 since the p value is less than the significance level.
-
Reject H0 since the p value is less than the significance level.
c. Interpret the results at α = 0.05.
-
We can cannot conclude that the mean difference differs from zero.
-
We conclude that the mean difference differs from zero.
-
We cannot conclude that that the mean difference is less than zero.
-
We conclude that the mean difference is less than zero.
Homework Answers
The statistical software output for this problem is :
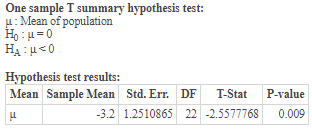
Test statistics = -2.56
P-value < 0.01
Reject H0 since the p value is less than the significance level.
We conclude that the mean difference is less than zero.
Add Answer to:
Consider the following competing hypotheses: (You may
find it useful to reference the appropriate table: z...
Consider the following competing hypotheses and accompanying sample data. (You may find it useful to reference...
Consider the following competing hypotheses and accompanying sample data. (You may find it useful to reference the appropriate table: z table or t table) H0: p1 − p2 ≥ 0 HA: p1 − p2 < 0 x1 = 250 x2 = 275 n1 = 400 n2 = 400 a. Calculate the value of the test statistic. (Negative value should be indicated by a minus sign. Round intermediate calculations to at least 4 decimal places and final answer to 2 decimal...
Consider the following competing hypotheses and accompanying sample data drawn independently from normally distributed populations. (You may find it useful to reference the appropriate table: z table or t table)
 Consider the following competing hypotheses and accompanying sample data drawn independently from normally distributed populations. (You may find it useful to reference the appropriate table: z table or t table) H0: μ1 − μ2 ≥ 0HA: μ1 − μ2 < 0 x¯1x¯1= 249x−2x−2= 262s1 = 35s2 = 23n1 = 10n2 = 10a-1. Calculate the value of the test statistic under the assumption that the population variances are equal. (Negative values should be indicated by a minus sign. Round all intermediate calculations to at least 4 decimal places and final answer to 3 decimal places.) a-2. Find the p-value. multiple choice 1p-value < 0.010.01 ≤ p-value...
Consider the following competing hypotheses and accompanying sample data (You may find it useful to reference...
 Consider the following competing hypotheses and accompanying sample data (You may find it useful to reference the appropriate table: z table or t table) Ho: Pi - P22 MA: P1 - P2 @ X1 - 238 nu - 425 X2 - 263 n2 - 425 a. Calculate the value of the test statistic (Negative value should be indicated by a minus sign. Round intermediate calculations to at least 4 decimal places and final answer to 2 decimal places.) Test statistic...
Consider the following hypotheses: H0: μ ≥ 160 HA: μ < 160 The population is normally...
Consider the following hypotheses: H0: μ ≥ 160 HA: μ < 160 The population is normally distributed. A sample produces the following observations: 152 138 151 144 151 142 Conduct the test at the 1% level of significance. (You may find it useful to reference the appropriate table: z table or t table) a. Calculate the value of the test statistic. (Negative value should be indicated by a minus sign. Round intermediate calculations to at least 4 decimal places and...
In order to conduct a hypothesis test for the population mean, a random sample of 24...
In order to conduct a hypothesis test for the population mean, a random sample of 24 observations is drawn from a normally distributed population. The resulting sample mean and sample standard deviation are calculated as 6.3 and 2.5, respectively. (You may find it useful to reference the appropriate table: z table or t table). H0: μ ≤ 5.1 against HA: μ > 5.1 a-1. Calculate the value of the test statistic. (Round all intermediate calculations to at least 4 decimal...
In order to conduct a hypothesis test for the population proportion, you sample 290 observations that...
In order to conduct a hypothesis test for the population proportion, you sample 290 observations that result in 87 successes. (You may find it useful to reference the appropriate table: z table or t table) H0: p ≥ 0.36; HA: p < 0.36. a-1. Calculate the value of the test statistic. (Negative value should be indicated by a minus sign. Round intermediate calculations to at least 4 decimal places and final answer to 2 decimal places.) a-2. Find the p-value....
Consider the following hypotheses: H0: μ = 410 HA: μ ≠ 410 The population is normally...
Consider the following hypotheses: H0: μ = 410 HA: μ ≠ 410 The population is normally distributed with a population standard deviation of 46. (You may find it useful to reference the appropriate table: z table or t table) a-1. Calculate the value of the test statistic with x−x− = 421 and n = 85. (Round intermediate calculations to at least 4 decimal places and final answer to 2 decimal places.) a-2. What is the conclusion at the 10% significance...
Consider the following competing hypotheses and accompanying sample data drawn independently from normally distributed populations. (You...
 Consider the following competing hypotheses and accompanying sample data drawn independently from normally distributed populations. (You may find it useful to reference the appropriate table: z table or t table) Ho: H1-Hu2 0 HA: H1 Hz< e 251 252 s1 39 s=19 n1=7 n 7 a-1. Calculate the value of the test statistic under the assumption that the population variances are equal. (Negative values should be indicated by a minus sign. Round all intermediate calculations to at least 4 decimal...
In order to conduct a hypothesis test for the population proportion, you sample 450 observations that...
 In order to conduct a hypothesis test for the population
proportion, you sample 450 observations that result in 189
successes. (You may find it useful to reference the
appropriate table: z table or t
table)
H0: p ≥ 0.45;
HA: p < 0.45.
a-1. Calculate the value of the test statistic.
(Negative value should be indicated by a minus sign. Round
intermediate calculations to at least 4 decimal places and final
answer to 2 decimal places.)
TEST STATISTIC =
a-2....
In order to conduct a hypothesis test for the population
proportion, you sample 450 observations that result in 189
successes. (You may find it useful to reference the
appropriate table: z table or t
table)
H0: p ≥ 0.45;
HA: p < 0.45.
a-1. Calculate the value of the test statistic.
(Negative value should be indicated by a minus sign. Round
intermediate calculations to at least 4 decimal places and final
answer to 2 decimal places.)
TEST STATISTIC =
a-2....
Consider the following hypotheses: H0: μ = 19 HA: μ ≠ 19 The population is normally...
Consider the following hypotheses: H0: μ = 19 HA: μ ≠ 19 The population is normally distributed. A sample produces the following observations: (You may find it useful to reference the appropriate table: z table or t table) 20 23 17 21 21 24 23 Click here for the Excel Data File a. Find the mean and the standard deviation. (Round your answers to 2 decimal places.) b. Calculate the value of the test statistic. (Round intermediate calculations to...
 Consider the following competing hypotheses and accompanying sample data (You may find it useful to reference the appropriate table: z table or t table) Ho: Pi - P22 MA: P1 - P2 @ X1 - 238 nu - 425 X2 - 263 n2 - 425 a. Calculate the value of the test statistic (Negative value should be indicated by a minus sign. Round intermediate calculations to at least 4 decimal places and final answer to 2 decimal places.) Test statistic...
 Consider the following competing hypotheses and accompanying sample data drawn independently from normally distributed populations. (You may find it useful to reference the appropriate table: z table or t table) Ho: H1-Hu2 0 HA: H1 Hz< e 251 252 s1 39 s=19 n1=7 n 7 a-1. Calculate the value of the test statistic under the assumption that the population variances are equal. (Negative values should be indicated by a minus sign. Round all intermediate calculations to at least 4 decimal...
 In order to conduct a hypothesis test for the population
proportion, you sample 450 observations that result in 189
successes. (You may find it useful to reference the
appropriate table: z table or t
table)
H0: p ≥ 0.45;
HA: p < 0.45.
a-1. Calculate the value of the test statistic.
(Negative value should be indicated by a minus sign. Round
intermediate calculations to at least 4 decimal places and final
answer to 2 decimal places.)
TEST STATISTIC =
a-2....
In order to conduct a hypothesis test for the population
proportion, you sample 450 observations that result in 189
successes. (You may find it useful to reference the
appropriate table: z table or t
table)
H0: p ≥ 0.45;
HA: p < 0.45.
a-1. Calculate the value of the test statistic.
(Negative value should be indicated by a minus sign. Round
intermediate calculations to at least 4 decimal places and final
answer to 2 decimal places.)
TEST STATISTIC =
a-2....
Most questions answered within 3 hours.
-
Where is the error in this code sequence?
String s1 = "Hello";
String s2 = "ello";...
asked 10 months ago -
Financial data for Joel de Paris, Inc., for last year
follow:
Joel de Paris, Inc.
Balance...
asked 10 months ago -
Consider this reaction:
Al2(SO4)3 (aq)+ BaCl3
(aq) Al2Cl6 (aq)- +
3BaSO4(s) . What is the...
asked 10 months ago -
Suppose that Savneet is considering increasing her
recent random sample from 20 car rentals to 40...
asked 10 months ago -
Trucks arrive at an unloading terminal at an average rate of 120
per hour.
Trucks arrive...
asked 10 months ago -
Why are methanol and ethanol completely soluble in water while
octanol is not very little soluble....
asked 10 months ago -
A facilities manager at a university reads in a research report
that the mean amount of...
asked 10 months ago -
When the CuSO4 is rehydrated by adding water to the anhydrous
compound, is this an endothermic...
asked 10 months ago -
A ray of sunlight is passing from diamond into crown glass; the
angle of incidence is...
asked 10 months ago -
A block of mass 0.249 kg is placed on top of a light, vertical
spring of...
asked 10 months ago -
how do the kidneys compensate in the presences of acidosis
a) trigger hyperventilate
b) reserve acid...
asked 10 months ago -
Question 501 pts
The rental rate of capital to the firm increases. Which of the
following...
asked 10 months ago