Use the following table to answer the questions below. x y -3 -3 0 0 0...
Use the following table to answer the questions below.
| x | y |
| -3 | -3 |
| 0 | 0 |
| 0 | 3 |
| 2 | 5 |
| 2 | 5 |
a) Find the correlation coefficient r=
b) Find the coefficient of determination ?^2 =
c) Interpret the coefficient of determination
95.0798536569581 OR 90.4017857142857 % of the variation
in x OR y is explained by x
OR y .
*for part c please solve which of the pairs for each set is the right answer for sets that say OR*
Homework Answers
The table for calculations is:

Hence,
a) Correlation coefficient
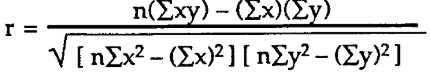
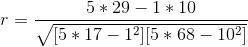
r = 0.9508
b) Coefficient of determination = r2 = (0.9508)2 = 0.9040
c) Interpretation: 90.4017857142857 % of the variation in y is explained by x
Add Answer to:
Use the following table to answer the questions below.
x
y
-3
-3
0
0
0...
Bighorn sheep are beautiful wild animals found throughout the western United States. Let x be the...
Bighorn sheep are beautiful wild animals found throughout the western United States. Let x be the age of a bighorn sheep (in years), and let y be the mortality rate (percent that die) for this age group. For example, x = 1, y = 14 means that 14% of the bighorn sheep between 1 and 2 years old died. A random sample of Arizona bighorn sheep gave the following information: x 1 2 3 4 5 y 15.8 19.3 14.4...
Please show all work AND any calculator functions. The table below summarizes data of heights and...
Please show all work AND any calculator functions. The table below summarizes data of heights and weights of 8 randomly selected adults. Use this information to answer parts a) – h). Height (x) in inches 5.2 5.6 5.8 5.9 5.4 6.1 6.0 5.7 Weight (y) in pounds 119 136 155 185 135 202 194 165 a) Test the claim ρ ≠ 0. Use α = 0.01. • State the hypotheses and label the claim. • State the significance level (α)....
***PLEASE DO ALL THIS IS MY LAST QUESTION OF THE GIVEN AMOUNT OF QUESTIONS :( *** Which value of r indicates a stronger correlation:r 0.751 orr0.896? Explain your reasoning Choose the correct answer...
 ***PLEASE DO ALL THIS IS MY LAST QUESTION OF THE GIVEN AMOUNT OF
QUESTIONS :( ***
Which value of r indicates a stronger correlation:r 0.751 orr0.896? Explain your reasoning Choose the correct answer below. A. r=-0.896 represents a stronger correlation because 0.751 >-0.896. B. r=0.751 represents a stronger correlation because l-08961-10.751. C· r--0 896 represents a stronger correlation because 1-0 8961-10751. D. 0.751 represents a stronger correlation because 0.751> -0.896. The budget (in millions of dollars) and worldwide gross (in...
***PLEASE DO ALL THIS IS MY LAST QUESTION OF THE GIVEN AMOUNT OF
QUESTIONS :( ***
Which value of r indicates a stronger correlation:r 0.751 orr0.896? Explain your reasoning Choose the correct answer below. A. r=-0.896 represents a stronger correlation because 0.751 >-0.896. B. r=0.751 represents a stronger correlation because l-08961-10.751. C· r--0 896 represents a stronger correlation because 1-0 8961-10751. D. 0.751 represents a stronger correlation because 0.751> -0.896. The budget (in millions of dollars) and worldwide gross (in...
Let x be the age of a licensed driver in years. Let y be the percentage...
Let x be the age of a licensed driver in years. Let y be the percentage of all fatal accidents (for a given age) due to failure to yield the right of way. For example, the first data pair states that 5% of all fatal accidents of 37-year-olds are due to failure to yield the right of way. x 37 47 57 67 77 87 y 5 8 10 17 29 41 Complete parts (a) through (e), given Σx =...
1. Use the table below to answer the following questions: (a) Find the value of the...
 1. Use the table below to answer the following questions: (a) Find the value of the linear correlation coefficient. (b) Assuming a 0.01 significance level, find the critical values. (c) Is there sufficient evidence to support the claim of a linear correlation? Explain your reasoning. x | 11-5|-19 41-17 2 ˇ -93-37 | 2가49 | 55 | 3 er
Question 3: Let’s say if you estimate a linear regression equation to be Y= 20 +...
Question 3: Let’s say if you estimate a linear regression equation to be Y= 20 + 4.2x + error, where x= pounds gained in weight and Y equals to miles run before running out of breath. If we know that r squared = 0.64, what can be said below for parts a and b. 1.) That the correlation coefficient is r= 0.80 (See other attachment referring to Answer to #3 for explanation) 2.) That the correlation coefficient is r= -...
Here is a bivariate data set. x y 44.1 57.5 28.1 30.4 19.3 21.1 19.4 7.6...
Here is a bivariate data set. x y 44.1 57.5 28.1 30.4 19.3 21.1 19.4 7.6 23.9 22.7 23.6 25.6 36.5 43.3 47.5 56 Find the correlation coefficient and report it accurate to three decimal places. r = What proportion of the variation in y can be explained by the variation in the values of x? Report answer as a percentage accurate to one decimal place. r² = %
The table shows the number of goals allowed and the total points earned (2 points for...
 The table shows the number of goals allowed and the total points earned (2 points for a win, and 1 point for an overtime or shoc season. The equation of the regression line is y = -0.600x + 225.826. Use the data to answer the following questions. (a) Find the coefficient of determination, and interpret the result. (b) Find the standard error of the estimate, se, and interpret the result. Goals 212 210 219 223 259 258 273 200 217...
BBA 403 TEST 3: Name: Score:_ SOLVE AND THOROUGHLY INTERPRET YOUR ANSWER 1. A marketing manager conducted a study to determine whether there is a linear relationship between many spent on adverti...
 BBA 403 TEST 3: Name: Score:_ SOLVE AND THOROUGHLY INTERPRET YOUR ANSWER 1. A marketing manager conducted a study to determine whether there is a linear relationship between many spent on advertising and company sales. The data are shown on the table below. Display the data in a scatter plot, calculate the correlation coefficient, state a conclusion, and interpret the result Adverstising Company Expense, (1000s of s) (1000s of ) 2.4 16 2.0 26 14 1.6 2.0 2.2 184 220...
Let x be the age of a licensed driver in years. Let y be the percentage...
Let x be the age of a licensed driver in years. Let y be the percentage of all fatal accidents (for a given age) due to failure to yield the right of way. For example, the first data pair states that 5% of all fatal accidents of 37-year-olds are due to failure to yield the right of way. x 37 47 57 67 77 87 y 5 8 10 17 33 42 Complete parts (a) through (e), given Σx =...
 ***PLEASE DO ALL THIS IS MY LAST QUESTION OF THE GIVEN AMOUNT OF
QUESTIONS :( ***
Which value of r indicates a stronger correlation:r 0.751 orr0.896? Explain your reasoning Choose the correct answer below. A. r=-0.896 represents a stronger correlation because 0.751 >-0.896. B. r=0.751 represents a stronger correlation because l-08961-10.751. C· r--0 896 represents a stronger correlation because 1-0 8961-10751. D. 0.751 represents a stronger correlation because 0.751> -0.896. The budget (in millions of dollars) and worldwide gross (in...
***PLEASE DO ALL THIS IS MY LAST QUESTION OF THE GIVEN AMOUNT OF
QUESTIONS :( ***
Which value of r indicates a stronger correlation:r 0.751 orr0.896? Explain your reasoning Choose the correct answer below. A. r=-0.896 represents a stronger correlation because 0.751 >-0.896. B. r=0.751 represents a stronger correlation because l-08961-10.751. C· r--0 896 represents a stronger correlation because 1-0 8961-10751. D. 0.751 represents a stronger correlation because 0.751> -0.896. The budget (in millions of dollars) and worldwide gross (in...
 1. Use the table below to answer the following questions: (a) Find the value of the linear correlation coefficient. (b) Assuming a 0.01 significance level, find the critical values. (c) Is there sufficient evidence to support the claim of a linear correlation? Explain your reasoning. x | 11-5|-19 41-17 2 ˇ -93-37 | 2가49 | 55 | 3 er
 The table shows the number of goals allowed and the total points earned (2 points for a win, and 1 point for an overtime or shoc season. The equation of the regression line is y = -0.600x + 225.826. Use the data to answer the following questions. (a) Find the coefficient of determination, and interpret the result. (b) Find the standard error of the estimate, se, and interpret the result. Goals 212 210 219 223 259 258 273 200 217...
 BBA 403 TEST 3: Name: Score:_ SOLVE AND THOROUGHLY INTERPRET YOUR ANSWER 1. A marketing manager conducted a study to determine whether there is a linear relationship between many spent on advertising and company sales. The data are shown on the table below. Display the data in a scatter plot, calculate the correlation coefficient, state a conclusion, and interpret the result Adverstising Company Expense, (1000s of s) (1000s of ) 2.4 16 2.0 26 14 1.6 2.0 2.2 184 220...
Most questions answered within 3 hours.
-
Where is the error in this code sequence?
String s1 = "Hello";
String s2 = "ello";...
asked 10 months ago -
Financial data for Joel de Paris, Inc., for last year
follow:
Joel de Paris, Inc.
Balance...
asked 10 months ago -
Consider this reaction:
Al2(SO4)3 (aq)+ BaCl3
(aq) Al2Cl6 (aq)- +
3BaSO4(s) . What is the...
asked 10 months ago -
Suppose that Savneet is considering increasing her
recent random sample from 20 car rentals to 40...
asked 10 months ago -
Trucks arrive at an unloading terminal at an average rate of 120
per hour.
Trucks arrive...
asked 10 months ago -
Why are methanol and ethanol completely soluble in water while
octanol is not very little soluble....
asked 10 months ago -
A facilities manager at a university reads in a research report
that the mean amount of...
asked 10 months ago -
When the CuSO4 is rehydrated by adding water to the anhydrous
compound, is this an endothermic...
asked 10 months ago -
A ray of sunlight is passing from diamond into crown glass; the
angle of incidence is...
asked 10 months ago -
A block of mass 0.249 kg is placed on top of a light, vertical
spring of...
asked 10 months ago -
how do the kidneys compensate in the presences of acidosis
a) trigger hyperventilate
b) reserve acid...
asked 10 months ago -
Question 501 pts
The rental rate of capital to the firm increases. Which of the
following...
asked 10 months ago