Phoebe keeps a bee farm next door to an apple orchard. She chooses her optimal number...
Phoebe keeps a bee farm next door to an apple orchard. She
chooses her optimal number of beehives by selecting the honey
output level at which her private marginal benefit from beekeeping
equals her private marginal cost. Use the following graph to answer
the questions below.
a. Assuming that Phoebe’s private marginal benefit and marginal
cost curves from beekeeping are normally shaped, identify which
curve is the private marginal benefit curve and which one is the
private marginal cost curve.
Instructions: In the graph above, use the
dropdowns to label each curve.
b. Phoebe’s bees help to pollinate the blossoms in the neighboring
apple orchard, and the more beehives she keeps, the larger the
fruit yield will be. Draw the social marginal benefit from Phoebe's
beekeeping.
Instructions: In the graph above, use the tool
"MBsocial" to draw the social marginal benefit
curve.
c. Phoebe’s bees are Africanized killer bees that aggressively
sting anyone who steps into their flight path, and the more
beehives Phoebe keeps, the more people will be stung. Phoebe,
fortunately, is naturally immune to the bees’ venom. Show the
social marginal cost curve from Phoebe’s beekeeping.
Instructions: In the graph above, use the tool
"MCsocial" to draw the social marginal cost curve.
d. The socially optimal quantity of beehives:
-
is greater than the privately optimal quantity.
-
is less than the privately optimal quantity.
-
could be greater than or less than the privately optimal quantity.
Homework Answers
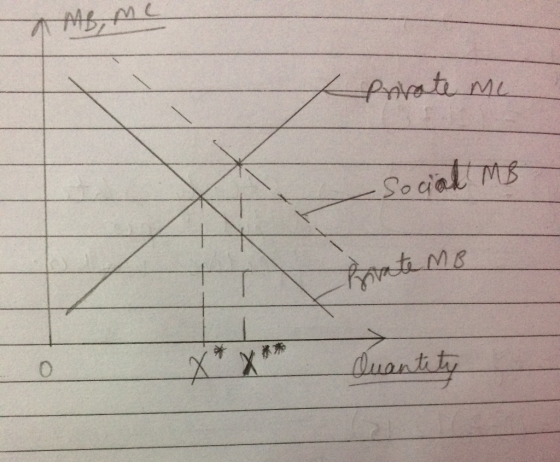
(a) Phoebe's private marginal benefit and marginal cost curve are normally shaped. So, MC curve is upward sloping and MB is downward sloping as shown below. The market output is denoted by X* at which MB and MC intersect.

(b) Phoebe’s bees help to pollinate the blossoms in the neighboring apple orchard, and the more beehives she keeps, the larger the fruit yield will be. This implies the positive externality .So, the social marginal benefit curve lies to the right of private marginal benefit curve. The socially optimal quantity is denoted by X** which is greater than market output X*. This is shown in the below graph.
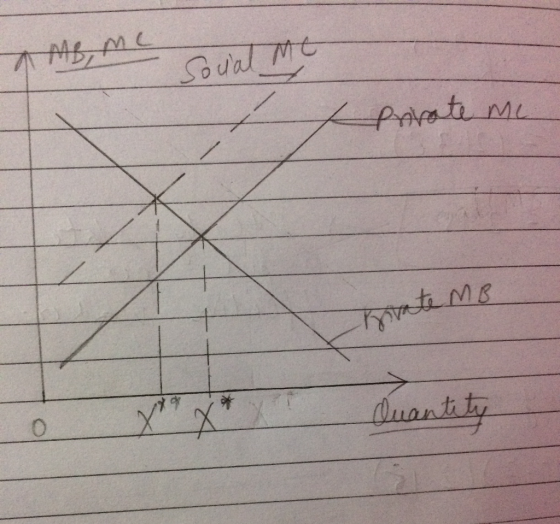
(c) Phoebe’s bees are killer bees that aggressively sting anyone who steps into their flight path . Phoebe. fortunately is immune to the bee's venom. This implies the negative externality.So, the social marginal cost curve lies to the left of private marginal cost curve . The socially optimal quantity is denoted by X** which is less than the market output X*. This is shown in the below graph.
(d) By combining both these effects. We can see that if positive effect is larger than negative effect then social benefit curve shift by large amount than social cost curve ,then socially optimal quantity is greater than private quantity.

And if negative effect is larger than positive effect, then social cost curve shift by large amount than social benefit curve , then socially optimal quantity is less than private quantity.

Hence, the socially optimal quantity of beehives could be greater than or less than the privately optimal quantity.
Add Answer to:
Phoebe keeps a bee farm next door to an apple orchard. She
chooses her optimal number...
An apple grower’s orchard provides nectar to a neighbor’s bees, while the beekeeper’s bees help the...
 An apple grower’s orchard provides nectar to a neighbor’s bees,
while the beekeeper’s bees help the apple grower by pollinating his
apple blossoms.
1) Consider the figure above. This situation of dual positive
externalities might lead to an underallocation of resources to both
apple growing and beekeeping because there are spillover
A.
costs for the apple growers but
spillover benefits for the beekeepers.
B.
benefits for the apple growers but
spillover costs for the beekeepers.
C.
benefits for both the...
An apple grower’s orchard provides nectar to a neighbor’s bees,
while the beekeeper’s bees help the apple grower by pollinating his
apple blossoms.
1) Consider the figure above. This situation of dual positive
externalities might lead to an underallocation of resources to both
apple growing and beekeeping because there are spillover
A.
costs for the apple growers but
spillover benefits for the beekeepers.
B.
benefits for the apple growers but
spillover costs for the beekeepers.
C.
benefits for both the...
The figure below shows supply and demand for planting trees, based on private costs and benefits....
 The figure below shows supply and demand for planting trees, based on private costs and benefits. Trees sequester carbon, meaning that they help counteract pollutants that contribute to climate change. Price of trees (S) Tools MCpm 20 18 16 14 A, DWL Social Cost 10 0 10 20 30 40 50 60 70 80 90 100 C Quantity of trees a. Suppose that the carbon sequestration that results from planting a tree is worth $4. Graph the social cost curve...
4. The effect of negative externalities on the optimal quantity of consumption Consider the market for...
 4. The effect of negative externalities on the optimal quantity of consumption Consider the market for paper. Suppose that a paper factory dumps toxic waste into a nearby river, creating a negative externality for those living downstream from the factory. Producing an additional ton of paper imposes a constant marginal external cost of $100 per ton. The following graph shows the demand curve and the private marginal cost (MC) curve for paper. (Note: The demand for the plant's paper is...
The figure below shows supply and demand for first-aid training, based on private costs and benefits.
 Problem 18-5 The figure below shows supply and demand for first-aid training, based on private costs and benefits. a. Suppose that the external benefit from first-aid training is worth $6. Graph the social benefit curve for first-aid training that accounts for the external benefit. Instructions: Use the tool provided (MBsociall and plot only the two endpoints across the entire range of output (0 - 30). b. Ignoring the social benefits of training, _______ hours of first-aid training will occur. c. The socially optimal quantity of...
1. Pigovian Taxes Widgets are a necessary part of modern life, but they are also associated...
1. Pigovian Taxes Widgets are a necessary part of modern life, but they are also associated with considerable pollution and pollution-related externalities. Consider the private market for widgets described by the following private marginal benefit (MB) and private marginal cost (PMC) curves: ????= 100 − 0.15???? ??????= 4 + 0.06????. where ???? is the quantity demanded and ???? is the quantity supplied. Assume here that output (???? and ????) varies from 0 to 1000. After plotting these curves, use them...
1. Externalities - Definition and examples Aa Aa E An extemality arises when a firm or...
 1. Externalities - Definition and examples Aa Aa E An extemality arises when a firm or person engages in an activity that influences the well-being of a third party, yet neither pays nor receives any compensation for that effect. If the impact on the third party is beneficial, it is called a extemality. With this type of extemality, in the absence of goverment intervention, the equilibrium quantity produced will be _ than the efficient quantity. The following graph shows the...
Problem Set 2. Market Failure: Externalities and Common Pool Resources EconS 326 1. Cigarette production requires...
 Problem Set 2. Market Failure: Externalities and Common Pool Resources EconS 326 1. Cigarette production requires use of energy, water and other resources. When planting tobacco leaves, fertilizer is used that creates runoff and water pollution in waterways. Tobacco smoke pollutes indoor and outdoor environments and remains a pervasive and persistent source of toxicants long after the cigarette is extinguished. a. Is there too little, too much or the correct amount of cigarette produced or consumed from a socially optimal...
This problem asks you to analyze environmental quality as a public good, but using a slightly...
This problem asks you to analyze environmental quality as a public good, but using a slightly different approach than was used in the class example. In class we measured environmental quality by the percent abated (20%, 60% etc), this time we will measure environmental quality in terms of the quantity of pollution abated. I ask you to go into some detail about your calculations, to illustrate your understanding intuitively and technically. The Valley of Grimes is inhabited by three people...
The table below shows the daily costs of Cathy's Corn Stand. Cathy sells her corn cobs...
The table below shows the daily costs of Cathy's Corn Stand. Cathy sells her corn cobs in a perfectly competitive market. Cathy's Corn Stand's Production Costs Quantity (corn cobs) AVC (dollars) ATC (dollars) MC (dollars) 10.00 $2.50 $5.00 $2.50 20.00 2.25 3.50 2.00 30.00 2.00 2.83 1.50 40.00 1.81 2.44 1.25 50.00 1.70 2.20 1.25 60.00 1.67 2.08 1.50 70.00 1.68 2.04 1.75 80.00 1.75 2.06 2.25 90.00 1.86 2.14 2.75 a. Draw Cathy's marginal cost (MC) curve. Instructions: Use...
The table below shows the daily costs of Cathy's Corn Stand. Cathy sells her corn cobs...
 The table below shows the daily costs of Cathy's Corn Stand. Cathy sells her corn cobs in a perfectly competitive market. Cathy's Corn Stand's Production Costs Quantity (corn cobs) AVC (dollars) 10.00 $2.50 20.00 2.25 30.00 2.00 40.00 1.81 50.00 1.70 60.00 1.67 70.00 1.68 80.00 1.75 90.00 ATC (dollars) $5.00 3.50 2.83 2.44 2.20 2.08 2.04 2.06 2.14 MC (dollars $2.50 2.00 1.50 1.25 1.25 1.50 1.75 2.25 2.75 a. Draw Cathy's marginal cost (MC) curve. Instructions: Use the...
 An apple grower’s orchard provides nectar to a neighbor’s bees,
while the beekeeper’s bees help the apple grower by pollinating his
apple blossoms.
1) Consider the figure above. This situation of dual positive
externalities might lead to an underallocation of resources to both
apple growing and beekeeping because there are spillover
A.
costs for the apple growers but
spillover benefits for the beekeepers.
B.
benefits for the apple growers but
spillover costs for the beekeepers.
C.
benefits for both the...
An apple grower’s orchard provides nectar to a neighbor’s bees,
while the beekeeper’s bees help the apple grower by pollinating his
apple blossoms.
1) Consider the figure above. This situation of dual positive
externalities might lead to an underallocation of resources to both
apple growing and beekeeping because there are spillover
A.
costs for the apple growers but
spillover benefits for the beekeepers.
B.
benefits for the apple growers but
spillover costs for the beekeepers.
C.
benefits for both the...
 The figure below shows supply and demand for planting trees, based on private costs and benefits. Trees sequester carbon, meaning that they help counteract pollutants that contribute to climate change. Price of trees (S) Tools MCpm 20 18 16 14 A, DWL Social Cost 10 0 10 20 30 40 50 60 70 80 90 100 C Quantity of trees a. Suppose that the carbon sequestration that results from planting a tree is worth $4. Graph the social cost curve...
 4. The effect of negative externalities on the optimal quantity of consumption Consider the market for paper. Suppose that a paper factory dumps toxic waste into a nearby river, creating a negative externality for those living downstream from the factory. Producing an additional ton of paper imposes a constant marginal external cost of $100 per ton. The following graph shows the demand curve and the private marginal cost (MC) curve for paper. (Note: The demand for the plant's paper is...
 1. Externalities - Definition and examples Aa Aa E An extemality arises when a firm or person engages in an activity that influences the well-being of a third party, yet neither pays nor receives any compensation for that effect. If the impact on the third party is beneficial, it is called a extemality. With this type of extemality, in the absence of goverment intervention, the equilibrium quantity produced will be _ than the efficient quantity. The following graph shows the...
 Problem Set 2. Market Failure: Externalities and Common Pool Resources EconS 326 1. Cigarette production requires use of energy, water and other resources. When planting tobacco leaves, fertilizer is used that creates runoff and water pollution in waterways. Tobacco smoke pollutes indoor and outdoor environments and remains a pervasive and persistent source of toxicants long after the cigarette is extinguished. a. Is there too little, too much or the correct amount of cigarette produced or consumed from a socially optimal...
 The table below shows the daily costs of Cathy's Corn Stand. Cathy sells her corn cobs in a perfectly competitive market. Cathy's Corn Stand's Production Costs Quantity (corn cobs) AVC (dollars) 10.00 $2.50 20.00 2.25 30.00 2.00 40.00 1.81 50.00 1.70 60.00 1.67 70.00 1.68 80.00 1.75 90.00 ATC (dollars) $5.00 3.50 2.83 2.44 2.20 2.08 2.04 2.06 2.14 MC (dollars $2.50 2.00 1.50 1.25 1.25 1.50 1.75 2.25 2.75 a. Draw Cathy's marginal cost (MC) curve. Instructions: Use the...
Most questions answered within 3 hours.
-
Where is the error in this code sequence?
String s1 = "Hello";
String s2 = "ello";...
asked 10 months ago -
Financial data for Joel de Paris, Inc., for last year
follow:
Joel de Paris, Inc.
Balance...
asked 10 months ago -
Consider this reaction:
Al2(SO4)3 (aq)+ BaCl3
(aq) Al2Cl6 (aq)- +
3BaSO4(s) . What is the...
asked 10 months ago -
Suppose that Savneet is considering increasing her
recent random sample from 20 car rentals to 40...
asked 10 months ago -
Trucks arrive at an unloading terminal at an average rate of 120
per hour.
Trucks arrive...
asked 10 months ago -
Why are methanol and ethanol completely soluble in water while
octanol is not very little soluble....
asked 10 months ago -
A facilities manager at a university reads in a research report
that the mean amount of...
asked 10 months ago -
When the CuSO4 is rehydrated by adding water to the anhydrous
compound, is this an endothermic...
asked 10 months ago -
A ray of sunlight is passing from diamond into crown glass; the
angle of incidence is...
asked 10 months ago -
A block of mass 0.249 kg is placed on top of a light, vertical
spring of...
asked 10 months ago -
how do the kidneys compensate in the presences of acidosis
a) trigger hyperventilate
b) reserve acid...
asked 10 months ago -
Question 501 pts
The rental rate of capital to the firm increases. Which of the
following...
asked 10 months ago