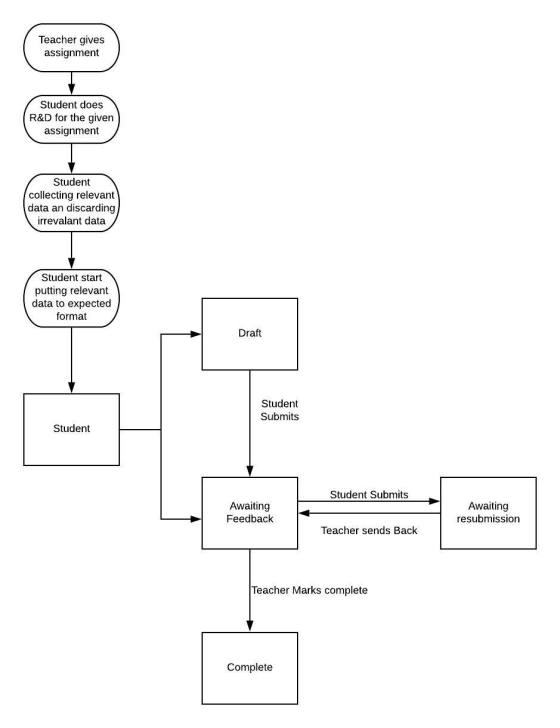
Using a tool of your choice draw and label a workflow which depicts a student submitting...
Using a tool of your choice draw and label a workflow which depicts a student submitting an assignment to the professor and the possible outcomes.
Homework Answers
Please refer the attached image for the workflow that depicts a student submitting an assignment to the professor and the possible outcomes.
Add Answer to:
Using a tool of your choice draw and label a workflow which
depicts a student submitting...
1.) Use the line drawing tool to draw the equation Y = 1 +X. Label your...
 1.) Use the line drawing tool to draw the equation Y = 1 +X. Label your line 'A'. 2.) Use the line drawing tool to draw the equation Y = 18-1.50X. Label your line 'B'. 3.) Use the point drawing tool to indicate the point where both equations are equal. Label this point 'Equilibrium'. Carefully follow the instructions above, and only draw the required objects. Price P = f(Q) 2 6 10 12 Quantity (Q) 14 16 18 20
10 Submitting an external tool Week 4 Assignment: Evaluating Probability with the Binom... Compute basic probability...
 10 Submitting an external tool Week 4 Assignment: Evaluating Probability with the Binom... Compute basic probability in a situation where there are equally-likely outcomes Question A baker finds several new recipes to try. Of the new recipes, there are 11 for cookies. 10 for muffins, and 4 for cakes. If the baker selects a recipe at random, what is the probability the recipe is for a cake? • Give your answer as a fraction Provide your answer below: SUBMIT FEEDBACK...
The figure to the right depicts the bond market. Show what will happen to interest rates...
 The figure to the right depicts the bond market. Show what will happen to interest rates if prices in the bond market become more volatile. 1. Using the line drawing tool, show the effect of this shock on the bond market. Properly label your line, 2. Using the point drawing tool, indicate the new equilibrium bond price and quantity. Label the point 2. Carefully follow the instructions above, and only draw the required objects. The effect of this shock will...
A country produces apples and wheat. 1.) Using the 3-point curved line drawing tool, draw...
A country produces apples and wheat. 1.) Using the 3-point curved line drawing tool, draw a representative PPC for this country. Label it 'PPC'. 2.) Using the point drawing tool, show a production point that is efficient. Label it 'A'. 3.) Using the point drawing tool, show a production point that is attainable but not efficient. Label it 'B'. Carefully follow the instructions above, and only draw the required objects.
ncept Question 3.6 )Using the 3-point curved line drawing tool, draw a ) Using the point...
 ncept Question 3.6 )Using the 3-point curved line drawing tool, draw a ) Using the point drawing tool, show a production point that is efficient. Label 'A ..) Using the point drawing fool, show. production point that is attaratie but not eficient. Labeit' arefully follow the instructions above, and only draw the required objects PPC for this country. Label # PPC Pears (millions of bushels per yea
Using the 3-point curved line drawing tool, draw a second isoquant that doubles output using a...
 Using the 3-point curved line drawing tool, draw a second isoquant that doubles output using a production function that exhibits constant returns to scale. Label your curve 'q 200. Carefully follow the instructions above, and only draw the required object
The graph to the right depicts the average cost curves and the marginal cost curve for...
 The graph to the right depicts the average cost curves and the marginal cost curve for a typical firm in a competitive industry. 1.) Using the line drawing fool, draw the firm's demand curve at a market price such that the firm is breaking even. Label your curved, 2.) Using the line drawing tool, draw the firm's demand curve at a market price such that the firm is at its shutdown price. Label your curved, Carefully follow the instructions above,...
draw the graph & label the points where they belong WIR With Graphing Questions - Clapter...
 draw the graph & label the points where they belong
WIR With Graphing Questions - Clapter 7 Clear All 2 The graph below depicts the production possibilities frontier (PPFO) for a particular country. The country is currently operating at point Using the appropriate tool, Illustrate short-run growth to a full employment level in this economy. Label any additions to the graph accordingly. Coordinates: (57.75, 92.00) Good A POFO ITIL Point B Unselected Good B Clear All 2 6. Which of...
draw the graph & label the points where they belong
WIR With Graphing Questions - Clapter 7 Clear All 2 The graph below depicts the production possibilities frontier (PPFO) for a particular country. The country is currently operating at point Using the appropriate tool, Illustrate short-run growth to a full employment level in this economy. Label any additions to the graph accordingly. Coordinates: (57.75, 92.00) Good A POFO ITIL Point B Unselected Good B Clear All 2 6. Which of...
Consider the figure to the right 1.) Using the 3-point curve drawing tool, draw a new...
 Consider the figure to the right 1.) Using the 3-point curve drawing tool, draw a new average cost curve that is consistent with an increase in fixed costs. Label this line 'AC2 МС, 2.) Using the point drawing tool, indicate the point on AC2 that is consistent with the output rate of 6 units per hour. Label this point 'B.' Carefully follow the instructions above, and only draw the required objects. AC1 6.00 d1 Output (units per hour)
Submitting an external tool Available Jul 29 at 12am - Jul 29 at 11:59pm 1 day...
 Submitting an external tool Available Jul 29 at 12am - Jul 29 at 11:59pm 1 day apter 5 Jessica Salmeron-Uribe Due in 3 hours, 58 minutes. Due Wed 07/29/2020 11:59 pm The following table represents the probability of the number of cars owned by a college student. Give your answer to at least 3 decimal places. 0.49 XP(x) 0 1 0.35 2 0.12 3 0.04 a) Is this a valid discrete probability distribution? Se ect an answer b) Find the...
 1.) Use the line drawing tool to draw the equation Y = 1 +X. Label your line 'A'. 2.) Use the line drawing tool to draw the equation Y = 18-1.50X. Label your line 'B'. 3.) Use the point drawing tool to indicate the point where both equations are equal. Label this point 'Equilibrium'. Carefully follow the instructions above, and only draw the required objects. Price P = f(Q) 2 6 10 12 Quantity (Q) 14 16 18 20
 10 Submitting an external tool Week 4 Assignment: Evaluating Probability with the Binom... Compute basic probability in a situation where there are equally-likely outcomes Question A baker finds several new recipes to try. Of the new recipes, there are 11 for cookies. 10 for muffins, and 4 for cakes. If the baker selects a recipe at random, what is the probability the recipe is for a cake? • Give your answer as a fraction Provide your answer below: SUBMIT FEEDBACK...
 The figure to the right depicts the bond market. Show what will happen to interest rates if prices in the bond market become more volatile. 1. Using the line drawing tool, show the effect of this shock on the bond market. Properly label your line, 2. Using the point drawing tool, indicate the new equilibrium bond price and quantity. Label the point 2. Carefully follow the instructions above, and only draw the required objects. The effect of this shock will...
 ncept Question 3.6 )Using the 3-point curved line drawing tool, draw a ) Using the point drawing tool, show a production point that is efficient. Label 'A ..) Using the point drawing fool, show. production point that is attaratie but not eficient. Labeit' arefully follow the instructions above, and only draw the required objects PPC for this country. Label # PPC Pears (millions of bushels per yea
 Using the 3-point curved line drawing tool, draw a second isoquant that doubles output using a production function that exhibits constant returns to scale. Label your curve 'q 200. Carefully follow the instructions above, and only draw the required object
 The graph to the right depicts the average cost curves and the marginal cost curve for a typical firm in a competitive industry. 1.) Using the line drawing fool, draw the firm's demand curve at a market price such that the firm is breaking even. Label your curved, 2.) Using the line drawing tool, draw the firm's demand curve at a market price such that the firm is at its shutdown price. Label your curved, Carefully follow the instructions above,...
 draw the graph & label the points where they belong
WIR With Graphing Questions - Clapter 7 Clear All 2 The graph below depicts the production possibilities frontier (PPFO) for a particular country. The country is currently operating at point Using the appropriate tool, Illustrate short-run growth to a full employment level in this economy. Label any additions to the graph accordingly. Coordinates: (57.75, 92.00) Good A POFO ITIL Point B Unselected Good B Clear All 2 6. Which of...
draw the graph & label the points where they belong
WIR With Graphing Questions - Clapter 7 Clear All 2 The graph below depicts the production possibilities frontier (PPFO) for a particular country. The country is currently operating at point Using the appropriate tool, Illustrate short-run growth to a full employment level in this economy. Label any additions to the graph accordingly. Coordinates: (57.75, 92.00) Good A POFO ITIL Point B Unselected Good B Clear All 2 6. Which of...
 Consider the figure to the right 1.) Using the 3-point curve drawing tool, draw a new average cost curve that is consistent with an increase in fixed costs. Label this line 'AC2 МС, 2.) Using the point drawing tool, indicate the point on AC2 that is consistent with the output rate of 6 units per hour. Label this point 'B.' Carefully follow the instructions above, and only draw the required objects. AC1 6.00 d1 Output (units per hour)
 Submitting an external tool Available Jul 29 at 12am - Jul 29 at 11:59pm 1 day apter 5 Jessica Salmeron-Uribe Due in 3 hours, 58 minutes. Due Wed 07/29/2020 11:59 pm The following table represents the probability of the number of cars owned by a college student. Give your answer to at least 3 decimal places. 0.49 XP(x) 0 1 0.35 2 0.12 3 0.04 a) Is this a valid discrete probability distribution? Se ect an answer b) Find the...
Most questions answered within 3 hours.
-
Where is the error in this code sequence?
String s1 = "Hello";
String s2 = "ello";...
asked 10 months ago -
Financial data for Joel de Paris, Inc., for last year
follow:
Joel de Paris, Inc.
Balance...
asked 10 months ago -
Consider this reaction:
Al2(SO4)3 (aq)+ BaCl3
(aq) Al2Cl6 (aq)- +
3BaSO4(s) . What is the...
asked 10 months ago -
Suppose that Savneet is considering increasing her
recent random sample from 20 car rentals to 40...
asked 10 months ago -
Trucks arrive at an unloading terminal at an average rate of 120
per hour.
Trucks arrive...
asked 10 months ago -
Why are methanol and ethanol completely soluble in water while
octanol is not very little soluble....
asked 10 months ago -
A facilities manager at a university reads in a research report
that the mean amount of...
asked 10 months ago -
When the CuSO4 is rehydrated by adding water to the anhydrous
compound, is this an endothermic...
asked 10 months ago -
A ray of sunlight is passing from diamond into crown glass; the
angle of incidence is...
asked 10 months ago -
A block of mass 0.249 kg is placed on top of a light, vertical
spring of...
asked 10 months ago -
how do the kidneys compensate in the presences of acidosis
a) trigger hyperventilate
b) reserve acid...
asked 10 months ago -
Question 501 pts
The rental rate of capital to the firm increases. Which of the
following...
asked 10 months ago