Use AD-SRAS-LRAS model to analyze how the following shocks will affect economic activity in the US...
Use AD-SRAS-LRAS model to analyze how the following shocks will affect economic activity in the US economy in the short and the long run; (Use diagram and properly label it to earn maximum points.)
For each shock:
- Illustrate changes that will occur using AD-AS graph, in short run and explain why each curve shifts.
- Determine how the prices and the output will be affected in the short-run.
- Mark the output gap on the diagram. Is the output gap positive or negative?
- On the same diagram, illustrate how the economy will adjust in the long run and explain the mechanism.
- Determine how the prices and output will be affected in the long-run.
The shocks are:
- India, a primary importer of US goods, imposes a tariff on US imports.
Homework Answers
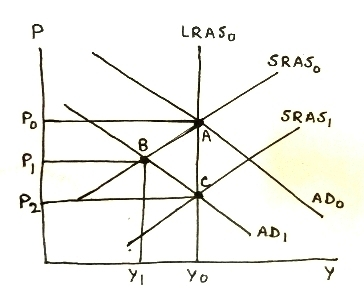
A tariff on US exports imposed by trading partner will decrease US exports, which will reduce US net exports, leading to a fall in aggregate demand. AD curve will shift to left, reducing both price level and real GDP, giving rise to a recessionary (negative output) gap in short run.
In the long run, lower price level will decrease wages and production costs. Firms will increase output, increasing aggregate supply. SRAS shifts rightward, intersecting new AD curve at further lower price level but restoring real GDP to potential GDP level.
In following graph, long-run equilibrium is at point A where AD0 (aggregate demand), LRAS0 (long-run aggregate supply) and SRAS0 (short-run aggregate supply) curves intersect with long-run equilibrium price level P0 and long-run equilibrium real GDP (potential GDP) Y0. When aggregate demand falls, AD curve will shift leftward from AD0 to AD1, intersecting SRAS0 at point B with lower price level P1 and lower real output Y1, with short run negative output gap of (Y0 - Y1). In the long run, SRAS0 shifts right to SRAS1, intersecting AD1 at point C with further lower price level P2 and restoring real GDP to potential GDP level Y0.
Add Answer to:
Use AD-SRAS-LRAS model to analyze how the following shocks will
affect economic activity in the US...
Using aggregate demand (AD), short-run aggregate supply (SRAS) and long-run aggregate supply (LRAS) curves
Question 1: AD-SRAS-LRAS Model Using aggregate demand (AD), short-run aggregate supply (SRAS) and long-run aggregate supply (LRAS) curves, graphically illustrate the effect of an increase in the money supply on output and prices in the short and long run. Assume that the economy is initially in long run equilibrium at the potential output level and prices are fixed in the short-run. In your graph, label "A" for the initial equilibrium, "B' for the short-run equilibrium, and "C" for the long-run equilibrium.
Por CPI LRAS, SRAS, AD AD, AD Y, Үр Ү, Yor Real GDP Suppose the economy...
 Por CPI LRAS, SRAS, AD AD, AD Y, Үр Ү, Yor Real GDP Suppose the economy is producing the output level Yp, and a positive demand shock shifts the AD, curve to AD2. The economy now has __ A. a recessionary gap and expansionary fiscal policy can close the gap. B. an inflationary gap and expansionary fiscal policy can close the gap. C. a recessionary gap and contractionary fiscal policy can close the gap. D. an inflationary gap and contractionary...
Assume that the US economy is initially at equilibrium with the intersection of AD curve, LRAS curve and SRAS curve. Ex...
Assume that the US economy is initially at equilibrium with the intersection of AD curve, LRAS curve and SRAS curve. Explain, using diagram, how a boom in the stock market will affect the initial equilibrium and the following macroeconomics variables: Output, Price, and employment. Using the diagram explain how the Fed should respond to this situation in order to stabilize output and employment.
1. Labour Market. Draw a diagram of the labour market where there above the equilibrium level....
 1. Labour Market. Draw a diagram of the labour market where there above the equilibrium level. Use I to denote the amount of labour to denote the amount of labour hired. bour market where the real wage is stuck note the amount of labour willing to work and L1 Now suppose there is an increase in technology that raises the demand the new demand curve and explain what happens to the and curve and explain what happens to the number...
Using the aggregate demand (AD), the short-run aggregate supply (SRAS), and the long-run aggregate supply (LRAS)...
Using the aggregate demand (AD), the short-run aggregate supply (SRAS), and the long-run aggregate supply (LRAS) curves, briefly explain how an open market purchase will affect the equilibrium price level (P) and real output (Y) in the short run. Assume the economy is initially in a recession?
2. The diagram below shows the current macroeconomic situation for the economy of Ukraine (LRAS stands...
 2. The diagram below shows the current macroeconomic situation for the economy of Ukraine (LRAS stands for Long-Run Aggregate Supply, SRAS stands for Short Run Aggregate Supply and AD for Aggregate Demand. You have been hired as an economic consultant to help the economy move to potential output, Y 0 LRAS SRAS AD Output, y a. Is Ukraine facing a recessionary or inflationary gap? Briefly explain b. Which type of fiscal policy expansionary or contractionary would move the economy of...
One of the major shocks to the US economy was the slump in the housing market...
One of the major shocks to the US economy was the slump in the housing market (note: housing is a major source of consumer wealth for many Americans). a. Draw the AD-AS model in equilibrium, before the shock. Be sure to label everything. (4 points) The Housing Price Index, published by the Office of Federal Housing Enterprise Oversight, calculates that US home prices fell by an average of 3.0% in the 12 months between January 2007 and January 2008. Illustrate...
()-run equilibrium occurs at the intersection of the aggregate demand curve, AD, and the short-run aggregate...
()-run equilibrium occurs at the intersection of the aggregate demand curve, AD, and the short-run aggregate supply curve, SRAS.() ▼ Long Short -run equilibrium occurs at the intersection of AD and the long-run aggregate supply curve, LRAS. Any unanticipated shifts in aggregate demand or supply are called aggregate demand or aggregate supply() ▼ shocks externalities . When aggregate demand decreases while aggregate supply is stable,() ▼ a recessionary an inflationary gap can occur, defined as the difference between how much...
1. Aggregate demand curve of an economy is given by AD = 51 - 0.2P, the...
1. Aggregate demand curve of an economy is given by AD = 51 - 0.2P, the long-run aggregate supply, LRAS, is 30 and the short-run aggregate supply is given by SRAS = 0.3 P (all output measures are in US$ billions and the price level is given as an index number). What could be the unemployment rate if the natural rate of unemployment is 4%? 2. Aggregate demand curve of an economy is given by AD = 51 - 0.2P,...
Unit 3: Aggregate Demand, Aggregate Supply, and Fiscal Policy AD, AS, and LRAS Short Run vs....
 Unit 3: Aggregate Demand, Aggregate Supply, and Fiscal Policy AD, AS, and LRAS Short Run vs. Long Run Aggregate Supply Draw the economy at full employment 1. In the short run, wages and resource prices will as price levels increase 2. In the long run, wages and resource prices will as price levels increase Shifters of AD and AS Shifters of Aggregate Demand Shifters of Aggregate Supply imi Recessionary Gap Draw an economy in a recession Inflationary Gap Draw an...
 Por CPI LRAS, SRAS, AD AD, AD Y, Үр Ү, Yor Real GDP Suppose the economy is producing the output level Yp, and a positive demand shock shifts the AD, curve to AD2. The economy now has __ A. a recessionary gap and expansionary fiscal policy can close the gap. B. an inflationary gap and expansionary fiscal policy can close the gap. C. a recessionary gap and contractionary fiscal policy can close the gap. D. an inflationary gap and contractionary...
 1. Labour Market. Draw a diagram of the labour market where there above the equilibrium level. Use I to denote the amount of labour to denote the amount of labour hired. bour market where the real wage is stuck note the amount of labour willing to work and L1 Now suppose there is an increase in technology that raises the demand the new demand curve and explain what happens to the and curve and explain what happens to the number...
 2. The diagram below shows the current macroeconomic situation for the economy of Ukraine (LRAS stands for Long-Run Aggregate Supply, SRAS stands for Short Run Aggregate Supply and AD for Aggregate Demand. You have been hired as an economic consultant to help the economy move to potential output, Y 0 LRAS SRAS AD Output, y a. Is Ukraine facing a recessionary or inflationary gap? Briefly explain b. Which type of fiscal policy expansionary or contractionary would move the economy of...
 Unit 3: Aggregate Demand, Aggregate Supply, and Fiscal Policy AD, AS, and LRAS Short Run vs. Long Run Aggregate Supply Draw the economy at full employment 1. In the short run, wages and resource prices will as price levels increase 2. In the long run, wages and resource prices will as price levels increase Shifters of AD and AS Shifters of Aggregate Demand Shifters of Aggregate Supply imi Recessionary Gap Draw an economy in a recession Inflationary Gap Draw an...
Most questions answered within 3 hours.
-
Where is the error in this code sequence?
String s1 = "Hello";
String s2 = "ello";...
asked 11 months ago -
Financial data for Joel de Paris, Inc., for last year
follow:
Joel de Paris, Inc.
Balance...
asked 11 months ago -
Consider this reaction:
Al2(SO4)3 (aq)+ BaCl3
(aq) Al2Cl6 (aq)- +
3BaSO4(s) . What is the...
asked 11 months ago -
Suppose that Savneet is considering increasing her
recent random sample from 20 car rentals to 40...
asked 11 months ago -
Trucks arrive at an unloading terminal at an average rate of 120
per hour.
Trucks arrive...
asked 11 months ago -
Why are methanol and ethanol completely soluble in water while
octanol is not very little soluble....
asked 11 months ago -
A facilities manager at a university reads in a research report
that the mean amount of...
asked 11 months ago -
When the CuSO4 is rehydrated by adding water to the anhydrous
compound, is this an endothermic...
asked 11 months ago -
A ray of sunlight is passing from diamond into crown glass; the
angle of incidence is...
asked 11 months ago -
A block of mass 0.249 kg is placed on top of a light, vertical
spring of...
asked 11 months ago -
how do the kidneys compensate in the presences of acidosis
a) trigger hyperventilate
b) reserve acid...
asked 11 months ago -
Question 501 pts
The rental rate of capital to the firm increases. Which of the
following...
asked 11 months ago