Choose a function of the form sin(2πnx/L) for some “large” integer frequency n and length L....
Choose a function of the form sin(2πnx/L) for some “large” integer frequency n and length L. (What is the Fourier transform of your function?) Uniformly sample the wave with an increment of ∆ over the range [0,L] and take the FFT of the sampled data. Start with a value of ∆ that allows for two or three samples. What frequencies are returned by the FFT? What can you say about how the FFT output changes as ∆ decreases?
please by using matlab
Homework Answers
close all
clear
clc
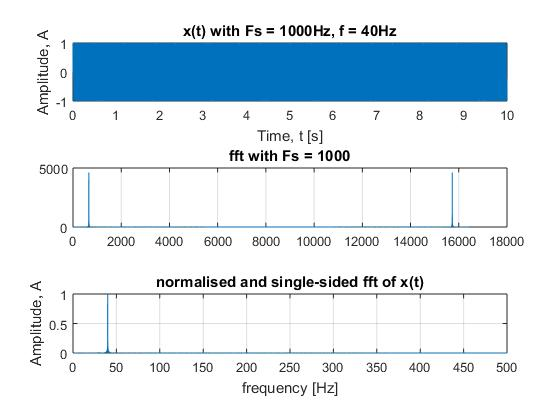
%% properties of sinusoid signal of the form x(t) =
sin(2*pi*f*(t/L))
f = 40; %Hz -->some large integer frequency of x(t)
%% %ALTER THIS VALUE (sampling time Ts) TO CHANGE THE SAMPLING
FREQUENCY (Fs = 1/Ts)
Ts = 0.001; %dt in s
%%
Fs = 1/Ts; %Hz -->sampling frequency of signal
L = 10; %maximum duration or length of the signal
t = 0:Ts:L-Ts; %duration of signal
A = 1; %-->Amplitude of signal
p = 0; %phase angle of signal
%%
x = A*sin(2*pi*f*t + p); % sinusoid x(t) = sin(2*pi*f*(t/L))
%% Performing FFT on x(t)
fftlength = 2^nextpow2(length(x));
ffft_one_sided_length = fftlength/2;
ffft = fft(x,fftlength); %applying Matlab inbuilt function
fft
ffft_normalised = ffft./(max(ffft));
ffft_shift = fftshift(ffft);
ffft_one_sided_normalised =
A.*ffft_normalised(1:ffft_one_sided_length);
fft_freq_x_axis_one_sided =
Fs*(0:ffft_one_sided_length-1)/fftlength;
%% plotting x(t) and its fft
figure
subplot(3,1,1)
%% plotting sinusoid signal x(t)
plot(t,x)
title(['x(t) with Fs = ' num2str(Fs) 'Hz, f = ' num2str(f)
'Hz'])
xlabel('Time, t [s]')
ylabel('Amplitude, A')
grid on
subplot(3,1,2)
plot(abs(ffft))
title(['fft with Fs = ' num2str(Fs)])
grid on
subplot(3,1,3)
plot(fft_freq_x_axis_one_sided,abs(ffft_one_sided_normalised))
title('normalised and single-sided fft of x(t)')
xlabel('frequency [Hz]')
ylabel('Amplitude, A')
grid on
--------------------------------------------------------------------------------------------------


explaining the behavior of the fft...
------------------------------consider the normalised (and single
sided) graphs of fft
-----------------------------------------------------------
for the first graphs (with lower Fs), the original signal is
indistinguishable -> fft gives different results for the same
signal x(t)
this is the aliasing problem where signals with higher frequency
are manifesting themselves as having lower frequency that are
recovered by fft
all the fft that applied a lower sampling frequency Fs could not
recover the frequency f of the original signal (40Hz)
until Fs was increased to a value equal to atleast than twice f
(until Fs>=80) since f is the highest frequency of the
x(t)
this proves the nyquist sampling theorem.
to recover frequency f of the a sampled signal, the sampling
frequecy Fs should be chosen such that Fs>=2f
COMMENT DOWN FOR ANY QUERY RELATED TO THIS ANSWER,
PLEASE PLEASE GIVE A THUMBS UP
Add Answer to:
Choose a function of the form sin(2πnx/L) for some “large”
integer frequency n and length L....
Program from problem 1: (Using MATLAB) % Sampling frequency and sampling period fs = 10000; ts...
 Program from problem 1: (Using MATLAB)
% Sampling frequency and sampling period
fs = 10000;
ts = 1/fs;
% Number of samples, assume 1000 samples
l = 1000;
t = 0:1:l-1;
t = t.*ts; % Convert the sample index into time for generation and
plotting of signal
% Frequency and amplitude of the sensor
f1 = 110;
a1 = 1.0;
% Frequency and amplitude of the power grid noise
f2 = 60;
a2 = 0.7;
% Generating the sinusoidal waves...
Program from problem 1: (Using MATLAB)
% Sampling frequency and sampling period
fs = 10000;
ts = 1/fs;
% Number of samples, assume 1000 samples
l = 1000;
t = 0:1:l-1;
t = t.*ts; % Convert the sample index into time for generation and
plotting of signal
% Frequency and amplitude of the sensor
f1 = 110;
a1 = 1.0;
% Frequency and amplitude of the power grid noise
f2 = 60;
a2 = 0.7;
% Generating the sinusoidal waves...
5 pts D Question 1 A system has the following impulse response: .2 Sample number, n From the choices below, select the frequency response of this system. H (eju)-e(1.5 ) (2 sin( 1.5ώ) +...
 5 pts D Question 1 A system has the following impulse response: .2 Sample number, n From the choices below, select the frequency response of this system. H (eju)-e(1.5 ) (2 sin( 1.5ώ) + 4 sin(0.δώ)) H (ee) = e-j(1.5e-5) (cos( 1.5 ) +2 cos(0.54)) @ H (ee)-e-n1.si) (sin( 1.54) t. 2 sin(0.δώ)) (sin(l.50) +4sin(0.0) H (ee)-e-j(1.5i) (2 cos( 1.5ώ) + 4 cos(0.5a)) H (efo)-e-n1.5u) (cos( 1.50) + 2 cos(0.50)) https://rmitinstructure.comcoursesy 5 pts DQuestion 2 A system has the following...
10. Write a one-page summary of the attached paper? INTRODUCTION Many problems can develop in activated...
10. Write a one-page summary of the attached paper? INTRODUCTION Many problems can develop in activated sludge operation that adversely affect effluent quality with origins in the engineering, hydraulic and microbiological components of the process. The real "heart" of the activated sludge system is the development and maintenance of a mixed microbial culture (activated sludge) that treats wastewater and which can be managed. One definition of a wastewater treatment plant operator is a "bug farmer", one who controls the aeration...
 Program from problem 1: (Using MATLAB)
% Sampling frequency and sampling period
fs = 10000;
ts = 1/fs;
% Number of samples, assume 1000 samples
l = 1000;
t = 0:1:l-1;
t = t.*ts; % Convert the sample index into time for generation and
plotting of signal
% Frequency and amplitude of the sensor
f1 = 110;
a1 = 1.0;
% Frequency and amplitude of the power grid noise
f2 = 60;
a2 = 0.7;
% Generating the sinusoidal waves...
Program from problem 1: (Using MATLAB)
% Sampling frequency and sampling period
fs = 10000;
ts = 1/fs;
% Number of samples, assume 1000 samples
l = 1000;
t = 0:1:l-1;
t = t.*ts; % Convert the sample index into time for generation and
plotting of signal
% Frequency and amplitude of the sensor
f1 = 110;
a1 = 1.0;
% Frequency and amplitude of the power grid noise
f2 = 60;
a2 = 0.7;
% Generating the sinusoidal waves...
 5 pts D Question 1 A system has the following impulse response: .2 Sample number, n From the choices below, select the frequency response of this system. H (eju)-e(1.5 ) (2 sin( 1.5ώ) + 4 sin(0.δώ)) H (ee) = e-j(1.5e-5) (cos( 1.5 ) +2 cos(0.54)) @ H (ee)-e-n1.si) (sin( 1.54) t. 2 sin(0.δώ)) (sin(l.50) +4sin(0.0) H (ee)-e-j(1.5i) (2 cos( 1.5ώ) + 4 cos(0.5a)) H (efo)-e-n1.5u) (cos( 1.50) + 2 cos(0.50)) https://rmitinstructure.comcoursesy 5 pts DQuestion 2 A system has the following...
Most questions answered within 3 hours.
-
Where is the error in this code sequence?
String s1 = "Hello";
String s2 = "ello";...
asked 10 months ago -
Financial data for Joel de Paris, Inc., for last year
follow:
Joel de Paris, Inc.
Balance...
asked 10 months ago -
Consider this reaction:
Al2(SO4)3 (aq)+ BaCl3
(aq) Al2Cl6 (aq)- +
3BaSO4(s) . What is the...
asked 10 months ago -
Suppose that Savneet is considering increasing her
recent random sample from 20 car rentals to 40...
asked 10 months ago -
Trucks arrive at an unloading terminal at an average rate of 120
per hour.
Trucks arrive...
asked 10 months ago -
Why are methanol and ethanol completely soluble in water while
octanol is not very little soluble....
asked 10 months ago -
A facilities manager at a university reads in a research report
that the mean amount of...
asked 10 months ago -
When the CuSO4 is rehydrated by adding water to the anhydrous
compound, is this an endothermic...
asked 10 months ago -
A ray of sunlight is passing from diamond into crown glass; the
angle of incidence is...
asked 10 months ago -
A block of mass 0.249 kg is placed on top of a light, vertical
spring of...
asked 10 months ago -
how do the kidneys compensate in the presences of acidosis
a) trigger hyperventilate
b) reserve acid...
asked 10 months ago -
Question 501 pts
The rental rate of capital to the firm increases. Which of the
following...
asked 10 months ago