Haskins Inc. reported the following 2017 income statement ($ thousands): 2017 Total Revenue $550,460 Cost of...
Haskins Inc. reported the following 2017 income statement ($ thousands):
|
2017 |
|
|
Total Revenue |
$550,460 |
|
Cost of Revenue |
262,810 |
|
Gross Profit |
287,650 |
|
Selling, General and Administrative Expenses |
95,740 |
|
Other Expenses |
22,780 |
|
Operating Income |
$169,130 |
Forecast 2018 operating income assuming a 2% increase in sales. Assume that the 2017 percentage relation of expenses to total revenue continue to hold in 2018.
Homework Answers
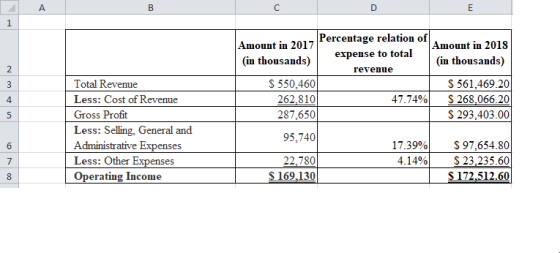
Therefore, the expected operating income in 2018 would be $172,512.60.
Working note:

Add Answer to:
Haskins Inc. reported the following
2017 income statement ($ thousands):
2017
Total Revenue
$550,460
Cost of...
UUTTUNU Below is part of Workiva Inc.'s income statements from 2016, 2017, and 2018 $ in thousands Revenue Cost of Reve...
 UUTTUNU Below is part of Workiva Inc.'s income statements from 2016, 2017, and 2018 $ in thousands Revenue Cost of Revenue Gross Profit Research & Development December December December 31, 2018 31, 2017 31, 2016 $244,344 $207,869 $178,646 65,860 60,245 51,625 178,484 147,624 127,021 81,602 68,172 57,438 General & administrative Expenses 90,337 84,161 80,466 Using 2016 as the base year what is the trend percentage of Revenue in 2017? [ Select] Using 2016 as the base year what is the...
Forecasting an Income Statement AutoZone Inc. reports the following income statements. Consolidated Statement of Income ($...
Forecasting an Income Statement AutoZone Inc. reports the following income statements. Consolidated Statement of Income ($ in Thousands) 12 Months Ended Aug. 27, 2016 Net sales $10,635,676 Cost of sales, including warehouse and delivery expenses 5,026,940 Gross profit 5,608,736 Operating, selling, general and administrative expenses 3,548,341 Operating profit 2,060,395 Interest expense, net 147,681 Income before income taxes 1,912,714 Income tax expense 671,707 Net income $1,241,007 Forecast AutoZone's 2017 income statement assuming the following income statement relations ($ in thousands). All...
ACTUAL FORECAST 2018 2019 Total Revenue $ 71,879 Cost of Revenue $ (51,125) Gross Profit $ ...
ACTUAL FORECAST 2018 2019 Total Revenue $ 71,879 Cost of Revenue $ (51,125) Gross Profit $ 20,754 Operating Expenses: Selling, General, and Administrative $ (14,248) Research and Development $ - Special Income/Other Charges $ (2,194) Total Operating Expenses $ (16,442) Operating Income $ 4,312 Net Interest Income $ (666) Pre-Tax Income $ 3,646 Provision for Income Tax (19.5%) $ (711) Net Income $ 2,935 Tag-It’s CEO has predicted a 10% increase in total revenue next year. Utilizing the percentage of...
I need Tesla inc. vertical analysis income statement for year 2017 and 2018. Tesla Inc. Vertical...
 I need Tesla inc. vertical
analysis income statement for year 2017 and 2018.
Tesla Inc. Vertical Analysis of Income Statement for 2017 and 2018 Model Tesla 2017 2018 Total Revenue Cost of Revenue Gross Profit 11,758,751 9,536,264 2,222,487 21,461,268 17,419,247 4,042,021 Operating Expenses Research Development Selling General & Admin Total Operating Expenses 1,378,073 2,476,500 3,854,573 1,460,370 2,834,491 4,294,861 Operating Income or Loss Interest Expense Total Other Income/Expense Net Income Before Tax Income Tax Expense Income From Continuing Operation (1,632,086) 471,259...
I need Tesla inc. vertical
analysis income statement for year 2017 and 2018.
Tesla Inc. Vertical Analysis of Income Statement for 2017 and 2018 Model Tesla 2017 2018 Total Revenue Cost of Revenue Gross Profit 11,758,751 9,536,264 2,222,487 21,461,268 17,419,247 4,042,021 Operating Expenses Research Development Selling General & Admin Total Operating Expenses 1,378,073 2,476,500 3,854,573 1,460,370 2,834,491 4,294,861 Operating Income or Loss Interest Expense Total Other Income/Expense Net Income Before Tax Income Tax Expense Income From Continuing Operation (1,632,086) 471,259...
Question 3 2.5 pts Below is part of Workiva Inc.'s income statements from 2016, 2017, and 2018 Sin thousands Decemb...
 Question 3 2.5 pts Below is part of Workiva Inc.'s income statements from 2016, 2017, and 2018 Sin thousands December 31, December 31, December 2018 2017 31, 2016 Revenue $244,344 $207,869 $178,646 Cost of Revenue 65,860 60,245 51,625 Gross Profit 178,484 147,624 127,021 Research & Development 81,602 68,172 57,438 General & administrative 90,337 84,161 80,466 Expenses Using 2016 as the base year what is the trend percentage of Revenue in 2017? Select ] Using 2016 as the base year what...
McCormick Designs, Inc. Comparative Income Statement Years Ended December 31, 2018 and 2017 2018 2017 Net...
 McCormick Designs, Inc. Comparative Income Statement Years Ended December 31, 2018 and 2017 2018 2017 Net Sales Revenue $ 431,500 $ 371,150 Expenses: Cost of Goods Sold 201,550 Selling and Administrative Expenses 100,050 8,000 186,250 94,000 6,000 Other Expenses Total Expenses 309,600 286,250 $ 121,900 $ 84,900 Net Income 1. Prepare a horizontal analysis of the comparative income statement of McCormick Designs, Inc. Round percentage changes to one decimal place. Why did 2018 net income increase by a higher percentage...
The income statement. ACTUAL FORECAST 2018 2019 ...
The income statement. ACTUAL FORECAST 2018 2019 $71,879 Cost of Revenue $(51,125) gross profit $20,754 operating expenses Selling, General, and Administrative $(14,248) ...
Apple Inc. CONSOLIDATED BALANCE SHEETS (In millions, except number of shares which are reflected in thousands...
 Apple Inc. CONSOLIDATED BALANCE SHEETS (In millions, except number of shares which are reflected in thousands and par value) September 29, 2018. September 30, + 2017 ASSETS:- Current assets $ Cash and cash equivalents Marketable securities Accounts receivable, net Inventories Vendor non-trade receivables. Other current assets- Total current assets 25,913 40,388 23,186 3,956 25,809 12,087 131,339 20.289 53 892 - 17,874 4,855 - 17.799 13,936 128,645 Non-current assets Marketable securities Property, plant and equipment, net Other non-current assets. Total non-current...
Question 1 0.25 Why are operations from discontinued operations reported separately from other operations? They aren't...
 Question 1 0.25 Why are operations from discontinued operations reported separately from other operations? They aren't listed separately. It is a requirement under the Sarbanes Oxley Act Discontinued operations will not continue into the future Question 2 0.75Apts Home M Below is part of Workiva Inc.'s income statements for 2016, 2017, and 2018. December 31, December 31, December $ in thousands 2018 2017 31, 2016 Revenue $244,344 65,860 178,484 $207,869 $178,646 51,625 Cost of Revenue 60,245 Gross Profit Research &...
Below is the comparative Income statement of C. Gabel, Inc. Click the icon to view the...
 Below is the comparative Income statement of C. Gabel, Inc. Click the icon to view the comparative income statement.) Read the requirements Requirement 1. Prepare a horizontal analysis of the comparative Income statement of C. Gabel, Inc. Round percentage changes to the nearest tenth of a percent, XX%. (Use a minus sign or parentheses for a decrease) C. Gabel, Inc. Horizontal Analysis of Comparative Income Statement Years Ended December 31, 2018 and 2017 Increase (Decrease) 2018 2017 Amount Percentage 515,000...
 UUTTUNU Below is part of Workiva Inc.'s income statements from 2016, 2017, and 2018 $ in thousands Revenue Cost of Revenue Gross Profit Research & Development December December December 31, 2018 31, 2017 31, 2016 $244,344 $207,869 $178,646 65,860 60,245 51,625 178,484 147,624 127,021 81,602 68,172 57,438 General & administrative Expenses 90,337 84,161 80,466 Using 2016 as the base year what is the trend percentage of Revenue in 2017? [ Select] Using 2016 as the base year what is the...
 I need Tesla inc. vertical
analysis income statement for year 2017 and 2018.
Tesla Inc. Vertical Analysis of Income Statement for 2017 and 2018 Model Tesla 2017 2018 Total Revenue Cost of Revenue Gross Profit 11,758,751 9,536,264 2,222,487 21,461,268 17,419,247 4,042,021 Operating Expenses Research Development Selling General & Admin Total Operating Expenses 1,378,073 2,476,500 3,854,573 1,460,370 2,834,491 4,294,861 Operating Income or Loss Interest Expense Total Other Income/Expense Net Income Before Tax Income Tax Expense Income From Continuing Operation (1,632,086) 471,259...
I need Tesla inc. vertical
analysis income statement for year 2017 and 2018.
Tesla Inc. Vertical Analysis of Income Statement for 2017 and 2018 Model Tesla 2017 2018 Total Revenue Cost of Revenue Gross Profit 11,758,751 9,536,264 2,222,487 21,461,268 17,419,247 4,042,021 Operating Expenses Research Development Selling General & Admin Total Operating Expenses 1,378,073 2,476,500 3,854,573 1,460,370 2,834,491 4,294,861 Operating Income or Loss Interest Expense Total Other Income/Expense Net Income Before Tax Income Tax Expense Income From Continuing Operation (1,632,086) 471,259...
 Question 3 2.5 pts Below is part of Workiva Inc.'s income statements from 2016, 2017, and 2018 Sin thousands December 31, December 31, December 2018 2017 31, 2016 Revenue $244,344 $207,869 $178,646 Cost of Revenue 65,860 60,245 51,625 Gross Profit 178,484 147,624 127,021 Research & Development 81,602 68,172 57,438 General & administrative 90,337 84,161 80,466 Expenses Using 2016 as the base year what is the trend percentage of Revenue in 2017? Select ] Using 2016 as the base year what...
 McCormick Designs, Inc. Comparative Income Statement Years Ended December 31, 2018 and 2017 2018 2017 Net Sales Revenue $ 431,500 $ 371,150 Expenses: Cost of Goods Sold 201,550 Selling and Administrative Expenses 100,050 8,000 186,250 94,000 6,000 Other Expenses Total Expenses 309,600 286,250 $ 121,900 $ 84,900 Net Income 1. Prepare a horizontal analysis of the comparative income statement of McCormick Designs, Inc. Round percentage changes to one decimal place. Why did 2018 net income increase by a higher percentage...
 Apple Inc. CONSOLIDATED BALANCE SHEETS (In millions, except number of shares which are reflected in thousands and par value) September 29, 2018. September 30, + 2017 ASSETS:- Current assets $ Cash and cash equivalents Marketable securities Accounts receivable, net Inventories Vendor non-trade receivables. Other current assets- Total current assets 25,913 40,388 23,186 3,956 25,809 12,087 131,339 20.289 53 892 - 17,874 4,855 - 17.799 13,936 128,645 Non-current assets Marketable securities Property, plant and equipment, net Other non-current assets. Total non-current...
 Question 1 0.25 Why are operations from discontinued operations reported separately from other operations? They aren't listed separately. It is a requirement under the Sarbanes Oxley Act Discontinued operations will not continue into the future Question 2 0.75Apts Home M Below is part of Workiva Inc.'s income statements for 2016, 2017, and 2018. December 31, December 31, December $ in thousands 2018 2017 31, 2016 Revenue $244,344 65,860 178,484 $207,869 $178,646 51,625 Cost of Revenue 60,245 Gross Profit Research &...
 Below is the comparative Income statement of C. Gabel, Inc. Click the icon to view the comparative income statement.) Read the requirements Requirement 1. Prepare a horizontal analysis of the comparative Income statement of C. Gabel, Inc. Round percentage changes to the nearest tenth of a percent, XX%. (Use a minus sign or parentheses for a decrease) C. Gabel, Inc. Horizontal Analysis of Comparative Income Statement Years Ended December 31, 2018 and 2017 Increase (Decrease) 2018 2017 Amount Percentage 515,000...
Most questions answered within 3 hours.
-
Where is the error in this code sequence?
String s1 = "Hello";
String s2 = "ello";...
asked 10 months ago -
Financial data for Joel de Paris, Inc., for last year
follow:
Joel de Paris, Inc.
Balance...
asked 10 months ago -
Consider this reaction:
Al2(SO4)3 (aq)+ BaCl3
(aq) Al2Cl6 (aq)- +
3BaSO4(s) . What is the...
asked 10 months ago -
Suppose that Savneet is considering increasing her
recent random sample from 20 car rentals to 40...
asked 10 months ago -
Trucks arrive at an unloading terminal at an average rate of 120
per hour.
Trucks arrive...
asked 10 months ago -
Why are methanol and ethanol completely soluble in water while
octanol is not very little soluble....
asked 10 months ago -
A facilities manager at a university reads in a research report
that the mean amount of...
asked 10 months ago -
When the CuSO4 is rehydrated by adding water to the anhydrous
compound, is this an endothermic...
asked 10 months ago -
A ray of sunlight is passing from diamond into crown glass; the
angle of incidence is...
asked 10 months ago -
A block of mass 0.249 kg is placed on top of a light, vertical
spring of...
asked 10 months ago -
how do the kidneys compensate in the presences of acidosis
a) trigger hyperventilate
b) reserve acid...
asked 10 months ago -
Question 501 pts
The rental rate of capital to the firm increases. Which of the
following...
asked 10 months ago