Illustrate (draw) and explain the Laffer Curve. Where are we currently as a nation (in your...
Illustrate (draw) and explain the Laffer Curve. Where are we currently as a nation (in your opinion) on the Laffer Curve?
Homework Answers
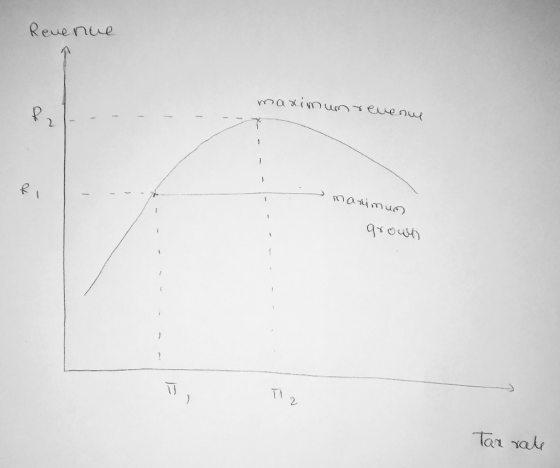
Larger curve is nothing but the curve which is a graphical representation that shows the relationship between the revenue generated by the government and the tax rate and in the graph as shown below you can actually get to see different tax rates for different revenues on the and this is illustrated by the larger curve. Since at a point, the Laffer curve is maximum growth point where maximum growth in the economy is observed as we increase the tax, people are less motivated to work or invest which increases the revenue but decreases the growth this is not preferred and in terms of US economy, the Laffer curve somewhere lies slightly above the maximum growth point on the whole.
Add Answer to:
Illustrate (draw) and explain the Laffer Curve.
Where are we currently as a nation (in your...
What is the difference between microeconomics and macroeconomics? Provide an example of each. Price discrimination. How...
What is the difference between microeconomics and macroeconomics? Provide an example of each. Price discrimination. How can this be a good thing for you personally? Illustrate (draw) and explain the Laffer Curve. Where are we currently as a nation (in your opinion) on the Laffer Curve?
3. This question concerns government and the Laffer Curve. a. Draw the Laffer Curve (with the...
3. This question concerns government and the Laffer Curve. a. Draw the Laffer Curve (with the correct axes) and explain what it means to “be on the wrong side of the Laffer Curve.” (2 points) b. When the following statement is made: “we want to broaden the base and lower the rates,” explain the impact of this on the taxes paid of high income people. (2 points) c. In order for tax cuts to increase revenue, explain what has to...
“Laffer Curve” a. What is Laffer Curve? b.As Canada recovers from the economic challenges brought on...
“Laffer Curve” a. What is Laffer Curve? b.As Canada recovers from the economic challenges brought on by the COVID pandemic, the federal government will make choices that will cause tax rates to rise or fall. This will cause a change in Canada’s position on the Laffer Curve. c. Explain what will happen to Canada’s position on the Laffer Curve for both the cases where the tax rates rise and when they fall. d. What will happen if Canada’s Tax Rate...
Problem 5 “Laffer Curve” (20 points) (6 pts) What is Laffer Curve? (8 pts) As Canada...
Problem 5 “Laffer Curve” (20 points) (6 pts) What is Laffer Curve? (8 pts) As Canada recovers from the economic challenges brought on by the COVID pandemic, the federal government will make choices that will cause tax rates to rise or fall. This will cause a change in Canada’s position on the Laffer Curve. Explain what will happen to Canada’s position on the Laffer Curve for both the cases where the tax rates rise and when they fall. (6 pts)...
Curve. Explain what will happen to Canada's position on the Laffer Curve for both the cases...
 Curve. Explain what will happen to Canada's position on the Laffer Curve for both the cases where the tax rates rise and when they fall. (6 pts) What will happen if Canada's Tax Rate grows higher than T*?
Problem 5 "Laffer Curve" (20 points) 1. (6 pts) What is Laffer Curve? 2. (8 pts)...
 Problem 5 "Laffer Curve" (20 points) 1. (6 pts) What is Laffer Curve? 2. (8 pts) As Canada recovers from the economic challenges brought on by the COVID pandemic, the federal government will make choices that will cause tax rates to rise or fall. This will cause a change in Canada's position on the Laffer Curve. Explain what will happen to Canada's position on the Laffer Curve for both the cases where the tax rates rise and when they fall....
1. (6 pts) What is Laffer Curve? 2. (8 pts) As Canada recovers from the economic...
 1. (6 pts) What is Laffer Curve? 2. (8 pts) As Canada recovers from the economic challenges brought on by the COVID pandemic, the federal government will make choices that will cause tax rates to rise or fall. This will cause a change in Canada's position on the Laffer Curve. Explain what will happen to Canada's position on the Laffer Curve for both the cases where the tax rates rise and when they fall. 3. (6 pts) What will happen...
Draw a production possibilities frontier curve. Illustrate the set of points that is feasible, the set...
Draw a production possibilities frontier curve. Illustrate the set of points that is feasible, the set of points that is efficient, the set of points that is inefficient, and the set of points that is not feasible. If you prefer not to draw then explain.
1. Labour Market. Draw a diagram of the labour market where there above the equilibrium level....
 1. Labour Market. Draw a diagram of the labour market where there above the equilibrium level. Use I to denote the amount of labour to denote the amount of labour hired. bour market where the real wage is stuck note the amount of labour willing to work and L1 Now suppose there is an increase in technology that raises the demand the new demand curve and explain what happens to the and curve and explain what happens to the number...
In this assignment, you will demonstrate your ability to draw a simple production possibilities curve given...
 In this assignment, you will demonstrate your ability to draw a simple production possibilities curve given data on the quantity of one input (labor) and the amount of labor required to produce each of two outputs (guns and butter). You should also be able to identify the opportunity cost of one good in terms of the other as the slope of the PPC. You will explain your analysis of the figures to explain why it's not possible to produce combinations...
 Curve. Explain what will happen to Canada's position on the Laffer Curve for both the cases where the tax rates rise and when they fall. (6 pts) What will happen if Canada's Tax Rate grows higher than T*?
 Problem 5 "Laffer Curve" (20 points) 1. (6 pts) What is Laffer Curve? 2. (8 pts) As Canada recovers from the economic challenges brought on by the COVID pandemic, the federal government will make choices that will cause tax rates to rise or fall. This will cause a change in Canada's position on the Laffer Curve. Explain what will happen to Canada's position on the Laffer Curve for both the cases where the tax rates rise and when they fall....
 1. (6 pts) What is Laffer Curve? 2. (8 pts) As Canada recovers from the economic challenges brought on by the COVID pandemic, the federal government will make choices that will cause tax rates to rise or fall. This will cause a change in Canada's position on the Laffer Curve. Explain what will happen to Canada's position on the Laffer Curve for both the cases where the tax rates rise and when they fall. 3. (6 pts) What will happen...
 1. Labour Market. Draw a diagram of the labour market where there above the equilibrium level. Use I to denote the amount of labour to denote the amount of labour hired. bour market where the real wage is stuck note the amount of labour willing to work and L1 Now suppose there is an increase in technology that raises the demand the new demand curve and explain what happens to the and curve and explain what happens to the number...
 In this assignment, you will demonstrate your ability to draw a simple production possibilities curve given data on the quantity of one input (labor) and the amount of labor required to produce each of two outputs (guns and butter). You should also be able to identify the opportunity cost of one good in terms of the other as the slope of the PPC. You will explain your analysis of the figures to explain why it's not possible to produce combinations...
Most questions answered within 3 hours.
-
Where is the error in this code sequence?
String s1 = "Hello";
String s2 = "ello";...
asked 10 months ago -
Financial data for Joel de Paris, Inc., for last year
follow:
Joel de Paris, Inc.
Balance...
asked 10 months ago -
Consider this reaction:
Al2(SO4)3 (aq)+ BaCl3
(aq) Al2Cl6 (aq)- +
3BaSO4(s) . What is the...
asked 10 months ago -
Suppose that Savneet is considering increasing her
recent random sample from 20 car rentals to 40...
asked 10 months ago -
Trucks arrive at an unloading terminal at an average rate of 120
per hour.
Trucks arrive...
asked 10 months ago -
Why are methanol and ethanol completely soluble in water while
octanol is not very little soluble....
asked 10 months ago -
A facilities manager at a university reads in a research report
that the mean amount of...
asked 10 months ago -
When the CuSO4 is rehydrated by adding water to the anhydrous
compound, is this an endothermic...
asked 10 months ago -
A ray of sunlight is passing from diamond into crown glass; the
angle of incidence is...
asked 10 months ago -
A block of mass 0.249 kg is placed on top of a light, vertical
spring of...
asked 10 months ago -
how do the kidneys compensate in the presences of acidosis
a) trigger hyperventilate
b) reserve acid...
asked 10 months ago -
Question 501 pts
The rental rate of capital to the firm increases. Which of the
following...
asked 10 months ago