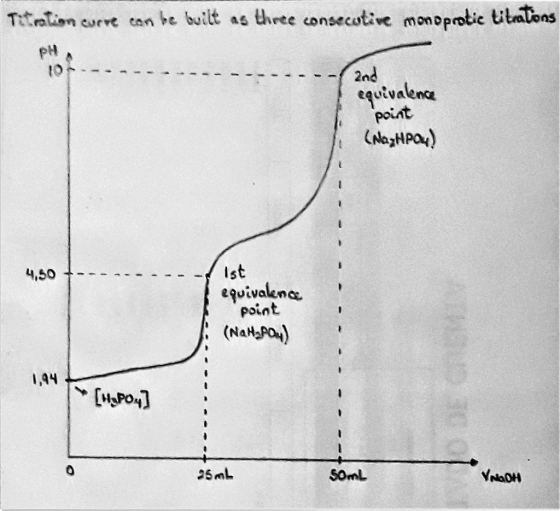
plot the titration curve for the determination of a 0.1 M H3PO4 pKs1=2 pKs2=7 pKs3=13 with...
plot the titration curve for the determination of a 0.1 M H3PO4 pKs1=2 pKs2=7 pKs3=13 with a 0.1 M NaOH
Homework Answers
If we assume a volume of 25 for both reagents, titration curve can be solved as follows:

And the plot of the titration curve:
Add Answer to:
plot the titration curve for the determination of a 0.1 M H3PO4
pKs1=2 pKs2=7 pKs3=13 with...
In the titration of 100 ml of a 0.1 M H3PO4 with 0.5 M NAOH, calculate...
In the titration of 100 ml of a 0.1 M H3PO4 with 0.5 M NAOH, calculate the pH of the solution at each of the following points: A) before any NaOH added B) After 10 mL of NaOH added C) at 1st equivalence point
Calculating Ka from titration curve. We titrated H3PO4 with NaOH. We began with 40.0 mL 0.0970...
Calculating Ka from titration curve. We titrated H3PO4 with NaOH. We began with 40.0 mL 0.0970 MH3PO4, titrated with 0.2085 M NaOH. We reached first equivalence at 18.78 mL NaOH titrated, and second equivalence at 38.50 mL titrated. Calculate Ka1 for H3PO4 using the following data obtained from a titration curve: 1) From the initial pH = 1.97 2) From the pH value half way to the first equivalence point = 2.10 Calculate Ka2 for H3PO4 from the following data...
(5) Sketch the titration curve for the titration of 0.1 M HCI with 0.1 M Na0H...
 (5) Sketch the titration curve for the titration of 0.1 M HCI with 0.1 M Na0H used as the titrant. Calculate and label the initial pH, equivalence point volume, and equivalence point pH. 3.
In the titration of 250.0 mL of 0.20 M H3PO4 with 0.10 M NaOH, the pH...
In the titration of 250.0 mL of 0.20 M H3PO4 with 0.10 M NaOH, the pH of the solution after the addition of some NaOH is 4.66. Which of the following phosphate-containing species is present in the largest amount? For H3PO4, Ka1 = 7.5 × 10⁻³, Ka2 = 6.2 × 10⁻⁸, and Ka3 = 4.8 × 10⁻¹³.
What is the initial pH expected for a 0.1 M solution of phosphoric acid (H3PO4)? For...
What is the initial pH expected for a 0.1 M solution of phosphoric acid (H3PO4)? For 30.0 mL of 0.1 M H3PO4 (aq), what volume of 0.1 M NaOH (aq) is required to fully titrate all three protons to their end points? In the titration of a weak acid with a strong base, how is the half equivalence point determined and what is its significance? How are the pKa and Ka of the weak acid determined from the half equivalence...
Plot the titration curve of aspartic acid it has a volume of
 Plot the titration curve of aspartic acid it has a volume of \(100 \mathrm{ml}\) and \(0.1 \mathrm{M}\) when titrated with \(0.1 \mathrm{M}\) KOH? \(p k a 1=2.09, p k a 2=3.86\)\(\mathrm{pka} 3=9.82 ?\)
The following graph shows the pH curve for the titration of 25 mL of a 0.1 M monoprotic acid solution with a 0.1 M solut...
 The following graph shows the pH curve for the titration of 25
mL of a 0.1 M monoprotic acid solution with a 0.1 M solution of a
monoprotic base.
#1's drop down menus both read weak/strong.
#2's drop down menu features a list of all the colors listed on the
graph.
0 5 10 15 20 25 30 35 40 45 50 mL of 0.1 M base added (1) The pH curve represents the titration of a __ acid with...
The following graph shows the pH curve for the titration of 25
mL of a 0.1 M monoprotic acid solution with a 0.1 M solution of a
monoprotic base.
#1's drop down menus both read weak/strong.
#2's drop down menu features a list of all the colors listed on the
graph.
0 5 10 15 20 25 30 35 40 45 50 mL of 0.1 M base added (1) The pH curve represents the titration of a __ acid with...
Sketch the titration plot that you would expect to obtain for complete titration of 25 mL...
Sketch the titration plot that you would expect to obtain for complete titration of 25 mL of 0.10 M H3PO4 with 0.20 M NaOH, indicating clearly the number of equivalence points and their volumes.
The following graph shows the pH curve for the titration of 25 mL of a 0.1...
 The following graph shows the pH curve for the titration of 25
mL of a 0.1 M monoprotic acid solution with a 0.1 M solution of a
monoprotic base.
mL of 0.1 M base added
(1) The pH curve represents the titration of a
_______(weak/strong) acid with a _______(weak/strong)base.
(2) Choose a suitable indicator for the endpoint
of the titration from the following pulldown list
__________.(bromocresol green / methyl red / bromothymol blue /
cresol red / thymol blue /...
The following graph shows the pH curve for the titration of 25
mL of a 0.1 M monoprotic acid solution with a 0.1 M solution of a
monoprotic base.
mL of 0.1 M base added
(1) The pH curve represents the titration of a
_______(weak/strong) acid with a _______(weak/strong)base.
(2) Choose a suitable indicator for the endpoint
of the titration from the following pulldown list
__________.(bromocresol green / methyl red / bromothymol blue /
cresol red / thymol blue /...
8. Prepare a titration curve for the titration of KHP with NaOH using the EXCEL spreadsheet...
 8. Prepare a titration curve for the titration of KHP with NaOH using the EXCEL spreadsheet template. Assume concentrations of 0.1 M for KHP and NaOH in preparing the titration curve. Attach a copy of the titration curve and explain why phenolphthalein can be used as the indicator for the titration. (3 pts) NOTE: see phthalic acid for the K, value for KHP.
 (5) Sketch the titration curve for the titration of 0.1 M HCI with 0.1 M Na0H used as the titrant. Calculate and label the initial pH, equivalence point volume, and equivalence point pH. 3.
 Plot the titration curve of aspartic acid it has a volume of \(100 \mathrm{ml}\) and \(0.1 \mathrm{M}\) when titrated with \(0.1 \mathrm{M}\) KOH? \(p k a 1=2.09, p k a 2=3.86\)\(\mathrm{pka} 3=9.82 ?\)
 The following graph shows the pH curve for the titration of 25
mL of a 0.1 M monoprotic acid solution with a 0.1 M solution of a
monoprotic base.
#1's drop down menus both read weak/strong.
#2's drop down menu features a list of all the colors listed on the
graph.
0 5 10 15 20 25 30 35 40 45 50 mL of 0.1 M base added (1) The pH curve represents the titration of a __ acid with...
The following graph shows the pH curve for the titration of 25
mL of a 0.1 M monoprotic acid solution with a 0.1 M solution of a
monoprotic base.
#1's drop down menus both read weak/strong.
#2's drop down menu features a list of all the colors listed on the
graph.
0 5 10 15 20 25 30 35 40 45 50 mL of 0.1 M base added (1) The pH curve represents the titration of a __ acid with...
 The following graph shows the pH curve for the titration of 25
mL of a 0.1 M monoprotic acid solution with a 0.1 M solution of a
monoprotic base.
mL of 0.1 M base added
(1) The pH curve represents the titration of a
_______(weak/strong) acid with a _______(weak/strong)base.
(2) Choose a suitable indicator for the endpoint
of the titration from the following pulldown list
__________.(bromocresol green / methyl red / bromothymol blue /
cresol red / thymol blue /...
The following graph shows the pH curve for the titration of 25
mL of a 0.1 M monoprotic acid solution with a 0.1 M solution of a
monoprotic base.
mL of 0.1 M base added
(1) The pH curve represents the titration of a
_______(weak/strong) acid with a _______(weak/strong)base.
(2) Choose a suitable indicator for the endpoint
of the titration from the following pulldown list
__________.(bromocresol green / methyl red / bromothymol blue /
cresol red / thymol blue /...
 8. Prepare a titration curve for the titration of KHP with NaOH using the EXCEL spreadsheet template. Assume concentrations of 0.1 M for KHP and NaOH in preparing the titration curve. Attach a copy of the titration curve and explain why phenolphthalein can be used as the indicator for the titration. (3 pts) NOTE: see phthalic acid for the K, value for KHP.
Most questions answered within 3 hours.
-
Where is the error in this code sequence?
String s1 = "Hello";
String s2 = "ello";...
asked 10 months ago -
Financial data for Joel de Paris, Inc., for last year
follow:
Joel de Paris, Inc.
Balance...
asked 10 months ago -
Consider this reaction:
Al2(SO4)3 (aq)+ BaCl3
(aq) Al2Cl6 (aq)- +
3BaSO4(s) . What is the...
asked 10 months ago -
Suppose that Savneet is considering increasing her
recent random sample from 20 car rentals to 40...
asked 10 months ago -
Trucks arrive at an unloading terminal at an average rate of 120
per hour.
Trucks arrive...
asked 10 months ago -
Why are methanol and ethanol completely soluble in water while
octanol is not very little soluble....
asked 10 months ago -
A facilities manager at a university reads in a research report
that the mean amount of...
asked 10 months ago -
When the CuSO4 is rehydrated by adding water to the anhydrous
compound, is this an endothermic...
asked 10 months ago -
A ray of sunlight is passing from diamond into crown glass; the
angle of incidence is...
asked 10 months ago -
A block of mass 0.249 kg is placed on top of a light, vertical
spring of...
asked 10 months ago -
how do the kidneys compensate in the presences of acidosis
a) trigger hyperventilate
b) reserve acid...
asked 10 months ago -
Question 501 pts
The rental rate of capital to the firm increases. Which of the
following...
asked 10 months ago