plot a 45 degree line using matlab that starts from coordinates (0,0)
Homework Answers
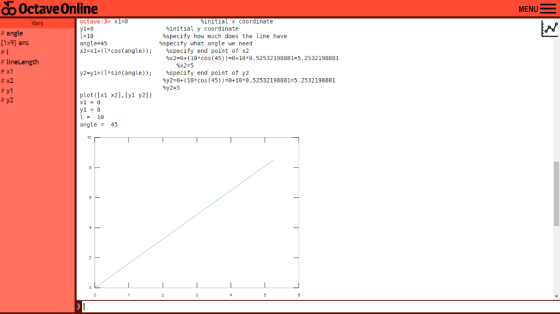
Here is the answer...
CODE:
x1=0 %initial x coordinate
y1=0 %initial y coordinate
l=10 %specify how much does the line have
angle=45 %specify what angle we need
x2=x1+(l*cos(angle)); %specify end point of x2
%cos(45)=5.2532198881 in radians
%x2=0+(10*cos(45))=0+10*0.52532198881=5.2532198881
%x2=5
y2=y1+(l*sin(angle)); %specify end point of y2
%y2=0+(10*cos(45))=0+10*0.52532198881=5.2532198881
%y2=5
plot([x1 x2],[y1 y2])
Another Way:
x1=0 %initial x coordinate
y1=0 %initial y coordinate
l=10 %specify how much does the line have
angle=45 %specify what angle we need
x2=x1+(5.2532198881); %specify end point of x2
%cos(45)=5.2532198881 in radians
%x2=0+(10*cos(45))=0+10*0.52532198881=5.2532198881
%x2=5
y2=y1+(5.2532198881); %specify end point of y2
%y2=0+(10*cos(45))=0+10*0.52532198881=5.2532198881
%y2=5
plot([x1 x2],[y1 y2])
OUTPUT:

If you have any doubts please COMMENT...
If you understand the answer please give THUMBS UP....
Add Answer to:
plot a 45 degree line using matlab that starts from coordinates
(0,0)
A particle starts from the origin (0,0) and moves to position (9,16) in 1.5s. If the...
A particle starts from the origin (0,0) and moves to position (9,16) in 1.5s. If the particle starts from rest, what is the acceleration in component form of the particle?
Please use MATLAB.Use MATLAB to solve the following problem. 6. Define two vectors (x and y)...
 Please use MATLAB.Use MATLAB to solve the
following problem.
6. Define two vectors (x and y) using coordinates from the figure below. Use plot function to get the same plane frame system like in the figure below. (15 points) (0,10) (10,10) (0,0) (10,0)
Please use MATLAB.Use MATLAB to solve the
following problem.
6. Define two vectors (x and y) using coordinates from the figure below. Use plot function to get the same plane frame system like in the figure below. (15 points) (0,10) (10,10) (0,0) (10,0)
Using MATLAB software For integer values of n ranging from 0 to 8, plot the discrete...
Using MATLAB software For integer values of n ranging from 0 to 8, plot the discrete data set: x[n] = ln(n)
An ant starts from the original of a 2-D grid, at the point (0,0). Then each...
An ant starts from the original of a 2-D grid, at the point (0,0). Then each time it moves either i) right by one unit distance, e.g., from (0,0) to (1,0), ii) up by one unit distance, e.g., from (0,0) to (0,1), or iii) stay still with probabilities 0.3, 0.2, and 0.5, respectively. After 10 moves, what is the probability that the ant settles down at point (2,5)?
MATLAB QUESTION Implement Least squares fitting for linear line detection in MATLAB. Using Any input image,...
MATLAB QUESTION Implement Least squares fitting for linear line detection in MATLAB. Using Any input image, After detection you need to plot output line on the input image used (you can use MATLAB functions for this purpose) Hint: find an appropriate input image and apply edge detection first. Then use MATLAB edge detector function and Implement Sobel edge detector. Write a report about it (written codes need to be included as a text as well).
Using Matlab. I need the matlab code for: a. Plot a 1 Hz sine wave b....
Using Matlab. I need the matlab code for: a. Plot a 1 Hz sine wave b. Plot the unit rectangle function. c. Plot the unit triangle function Show each over a plotting interval -5 sec to 5 sec.
MATLAB PROGRAM FOR THE FOLLOWING PROBLEM Using Matlab write a program that will plot the pressure...
 MATLAB PROGRAM FOR THE FOLLOWING PROBLEM
Using Matlab write a program that will plot the pressure signal, the perceived pressure signal, the resistance and the output voltage as functions of time, for Problem 1.30 in the textbook. (B) Using Matlab show a plot with the output voltage range if we happen to know that the transfer function (gain) has an uncertainty of 15% and the time constant has an uncertainty of 10%. (Note: the solution of the problem is provided...
MATLAB PROGRAM FOR THE FOLLOWING PROBLEM
Using Matlab write a program that will plot the pressure signal, the perceived pressure signal, the resistance and the output voltage as functions of time, for Problem 1.30 in the textbook. (B) Using Matlab show a plot with the output voltage range if we happen to know that the transfer function (gain) has an uncertainty of 15% and the time constant has an uncertainty of 10%. (Note: the solution of the problem is provided...
2. A marksman is shooting at (0,0). Let (X, Y) be the coordinates of the hit. Assume X, Y are ind...
 2. A marksman is shooting at (0,0). Let (X, Y) be the coordinates of the hit. Assume X, Y are independent N (0,02) (a) Find the joint pdf of (X, Y), (b) Find the pdf of V = X2 + Y2. Hint. First find the cdf F (r) = P (V-r) using polar coordinates and joint pdf from (a).
2. A marksman is shooting at (0,0). Let (X, Y) be the coordinates of the hit. Assume X, Y are independent...
2. A marksman is shooting at (0,0). Let (X, Y) be the coordinates of the hit. Assume X, Y are independent N (0,02) (a) Find the joint pdf of (X, Y), (b) Find the pdf of V = X2 + Y2. Hint. First find the cdf F (r) = P (V-r) using polar coordinates and joint pdf from (a).
2. A marksman is shooting at (0,0). Let (X, Y) be the coordinates of the hit. Assume X, Y are independent...
Plot f(x) = x^3 - y using MATLAB. Include zero crossings in the plot.
Plot f(x) = x^3 - y using MATLAB. Include zero crossings in the plot.
what is the command to plot line y=x in matlab between x=-5 to x=5
what is the command to plot line y=x in matlab between x=-5 to x=5
 Please use MATLAB.Use MATLAB to solve the
following problem.
6. Define two vectors (x and y) using coordinates from the figure below. Use plot function to get the same plane frame system like in the figure below. (15 points) (0,10) (10,10) (0,0) (10,0)
Please use MATLAB.Use MATLAB to solve the
following problem.
6. Define two vectors (x and y) using coordinates from the figure below. Use plot function to get the same plane frame system like in the figure below. (15 points) (0,10) (10,10) (0,0) (10,0)
 MATLAB PROGRAM FOR THE FOLLOWING PROBLEM
Using Matlab write a program that will plot the pressure signal, the perceived pressure signal, the resistance and the output voltage as functions of time, for Problem 1.30 in the textbook. (B) Using Matlab show a plot with the output voltage range if we happen to know that the transfer function (gain) has an uncertainty of 15% and the time constant has an uncertainty of 10%. (Note: the solution of the problem is provided...
MATLAB PROGRAM FOR THE FOLLOWING PROBLEM
Using Matlab write a program that will plot the pressure signal, the perceived pressure signal, the resistance and the output voltage as functions of time, for Problem 1.30 in the textbook. (B) Using Matlab show a plot with the output voltage range if we happen to know that the transfer function (gain) has an uncertainty of 15% and the time constant has an uncertainty of 10%. (Note: the solution of the problem is provided...
 2. A marksman is shooting at (0,0). Let (X, Y) be the coordinates of the hit. Assume X, Y are independent N (0,02) (a) Find the joint pdf of (X, Y), (b) Find the pdf of V = X2 + Y2. Hint. First find the cdf F (r) = P (V-r) using polar coordinates and joint pdf from (a).
2. A marksman is shooting at (0,0). Let (X, Y) be the coordinates of the hit. Assume X, Y are independent...
2. A marksman is shooting at (0,0). Let (X, Y) be the coordinates of the hit. Assume X, Y are independent N (0,02) (a) Find the joint pdf of (X, Y), (b) Find the pdf of V = X2 + Y2. Hint. First find the cdf F (r) = P (V-r) using polar coordinates and joint pdf from (a).
2. A marksman is shooting at (0,0). Let (X, Y) be the coordinates of the hit. Assume X, Y are independent...
Most questions answered within 3 hours.
-
Where is the error in this code sequence?
String s1 = "Hello";
String s2 = "ello";...
asked 10 months ago -
Financial data for Joel de Paris, Inc., for last year
follow:
Joel de Paris, Inc.
Balance...
asked 10 months ago -
Consider this reaction:
Al2(SO4)3 (aq)+ BaCl3
(aq) Al2Cl6 (aq)- +
3BaSO4(s) . What is the...
asked 10 months ago -
Suppose that Savneet is considering increasing her
recent random sample from 20 car rentals to 40...
asked 10 months ago -
Trucks arrive at an unloading terminal at an average rate of 120
per hour.
Trucks arrive...
asked 10 months ago -
Why are methanol and ethanol completely soluble in water while
octanol is not very little soluble....
asked 10 months ago -
A facilities manager at a university reads in a research report
that the mean amount of...
asked 10 months ago -
When the CuSO4 is rehydrated by adding water to the anhydrous
compound, is this an endothermic...
asked 10 months ago -
A ray of sunlight is passing from diamond into crown glass; the
angle of incidence is...
asked 10 months ago -
A block of mass 0.249 kg is placed on top of a light, vertical
spring of...
asked 10 months ago -
how do the kidneys compensate in the presences of acidosis
a) trigger hyperventilate
b) reserve acid...
asked 10 months ago -
Question 501 pts
The rental rate of capital to the firm increases. Which of the
following...
asked 10 months ago