You are not sure that the forecasting technique that your company is using is correct for...
|
You are not sure that the forecasting technique that your company is using is correct for two items that you manage. At this time you want to consider several new options and pick the one that reduces the amount of forecast error. To accomplish this task you will use the data listed below.
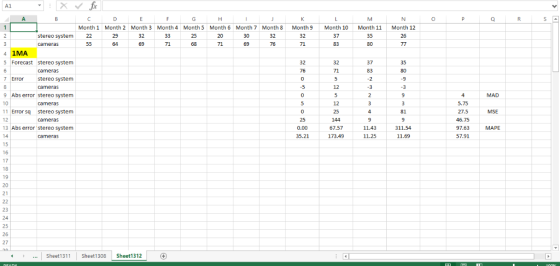
Step 1. Use the first 8 months of data (Month 1-8) to develop a forecast for Month 9 using 1 month moving average, 3 month moving average, Exponential Smoothing (alpha=.2), Exponential Smoothing (alpha=.4), and linear regression. For Exponential Smoothing you can use the forecasted value of 70 for month 8 for backup cameras and 30 for speakers. Please note that in this step you are pretending like you do not have the information for months 9-12 because you are holding this information aside to test what would have happened using your forecasting techniques. 2. Make forecasts for months 9-12 and calculate MSE, MAD, and MAPE for each of the forecasting techniques. 3. Based on your analysis, make a recommendation to the Operations Manager for which forecasting technique you should use for each of the two items and state why. You should include graphics to support your recommendation. |
||||||||||||||||||||||||||||||||||||||||
Homework Answers
In the moving average method we average the n periods and forecast for n+1 period.
In case of exponential smoothing we use the formula F2 = alpha*A1 + (1 – alpha)*F1
In case of linear regression we consider the period as the x variable and the data to be y variable.
1 month moving average
3 month moving average

ES 0.2

ES 0.4

Linear regression

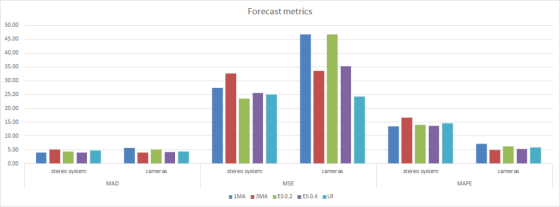
The table below summarizes the MAD, MSE, and MAPE for each of the products and the product line.
| 1MA | 3MA | ES 0.2 | ES 0.4 | LR | ||
| MAD | stereo system | 4.00 | 5.08 | 4.37 | 4.12 | 4.73 |
| cameras | 5.75 | 4.08 | 5.17 | 4.26 | 4.46 | |
| MSE | stereo system | 27.50 | 32.69 | 23.61 | 25.62 | 25.08 |
| cameras | 46.75 | 33.53 | 46.71 | 35.19 | 24.19 | |
| MAPE | stereo system | 13.46 | 16.76 | 13.98 | 13.65 | 14.56 |
| cameras | 7.29 | 5.03 | 6.37 | 5.26 | 5.86 |
The graph below shows the comparison. Looking at the graph we can see that for Stereo systems, 1 month moving average seems to be the best option as it has lowest value when MAD, MSE, MAPE are considered. Similarly for cameras, 3 months moving average yields the best result.
Add Answer to:
You are not sure that the forecasting technique that your
company is using is correct for...
The manager of a travel agency asked you to come up with a forecasting technique that...
The manager of a travel agency asked you to come up with a forecasting technique that will best fit to the actual demand for packaged tours. You have observed and recorded the actual demand for the last 10 periods. You also identified two possible techniques for consideration: 2-month moving averages (F1), and exponential smoothing (F2) with a smoothing constant of 0.40. Using Cumulative Forecasting Error (CFE) and Mean Absolute Deviation (MAD) as your performance measures you will determine the technique...
The manager of a travel agency asked you to come up with a forecasting technique that...
 The manager of a travel agency asked you to come up with a forecasting technique that will best fit to the actual demand for packaged tours. You have observed and recorded the actual demand for the last 10 periods. You also identified two possible techniques for consideration: 2-month moving averages (F1), and exponential smoothing (F2) with a smoothing constant of 0.40. Using Cumulathve Forecasting Erro (CFE) and Mean Absolute Daviation (MAD) as your performance measures you will detarmine tha technique...
Complete PART (b) ONLY. Please use answer from Part (a). Please complete this using EXCEL; SHow...
 Complete PART (b) ONLY. Please use answer from Part
(a). Please complete this using EXCEL; SHow the steps/ excel
calculations.
Month
Actual Demand
1
62
2
65
3
67
4
68
5
71
6
73
7
76
8
78
9
78
10
80
11
84
12
85
part (a)
MY answer to Part (a):
Part (b)
(b) Now calculate all the measures of
forecasting accuracy listed below for the single exponential
smoothing forecast completed in part (a)
-i) MAPE (Mean...
Complete PART (b) ONLY. Please use answer from Part
(a). Please complete this using EXCEL; SHow the steps/ excel
calculations.
Month
Actual Demand
1
62
2
65
3
67
4
68
5
71
6
73
7
76
8
78
9
78
10
80
11
84
12
85
part (a)
MY answer to Part (a):
Part (b)
(b) Now calculate all the measures of
forecasting accuracy listed below for the single exponential
smoothing forecast completed in part (a)
-i) MAPE (Mean...
You are an operation manager at Gambas Berhad. You plan to use several forecasting methods for...
 You are an operation manager at Gambas Berhad. You plan to use several forecasting methods for the purpose. The following data represent the actual monthly company sales for 2018. Month Value (RM000 32 41 53 59 46 31 27 24 10 35 54 105 Ja March ril un August ber November December (a) Calculate the Mean Absolute Deviation (MAD) and make a forecast for January 2019 sales based on the following methods: i. 4-month moving average. (5 marks) i. Weighted...
A manager has been using a certain technique to forecast demand for project management software at...
A manager has been using a certain technique to forecast demand for project management software at her store. Actual demand and her corresponding predictions are shown below: MonthActual Demand Manager's Forecast March4545April4250May3445June4840July3845 a. What was the manager's forecast error for each month?b. What is the mean error (ME), the mean squared error (MSE), the mean absolute deviation (MAD), and the tracking signal for these five months of forecasting?c. If the manager had used a 3-month moving average instead of her technique, what would have...
Homework #6 NAME: (State numerical answers #1 Use the leffersonCommunityCollege data set to answe...
 Homework #6 NAME: (State numerical answers #1 Use the leffersonCommunityCollege data set to answer the following questions. #1.1 The 3-period Moving Average forecast for Period 10 is #1.2 The 5-period Moving Average forecast for Period 10 is The MSE, MAE, and MAPE scores for the 3-period and 5-period Moving Average models are: Section: 9:30 12:30 Also put your name on the top of the back of the page Circle one. to four decimal places) 3-period Moving Average S-period Moving Average...
H.W 13 Q5 QUESTION 5 The manager of a travel agency asked you to come up...
 H.W 13 Q5
QUESTION 5 The manager of a travel agency asked you to come up with a forecasting technique that will best fit to the actual demand for packaged tours. You have observed and recorded the actual demand for the last 10 periods. You also identified two possible techniques for consideration: 2-month moving averages (F1), and exponential smoothing (F2) with a smoothing constant of 0.35. Using Cumulative Forecasting Error (CFE) and Mean Absolute Deviation (MAD) as your performance measures...
H.W 13 Q5
QUESTION 5 The manager of a travel agency asked you to come up with a forecasting technique that will best fit to the actual demand for packaged tours. You have observed and recorded the actual demand for the last 10 periods. You also identified two possible techniques for consideration: 2-month moving averages (F1), and exponential smoothing (F2) with a smoothing constant of 0.35. Using Cumulative Forecasting Error (CFE) and Mean Absolute Deviation (MAD) as your performance measures...
PLEASE ANSWER!!!!!!!! Use scratch paper as needed. Be sure to label the answer if it is written on the scratch pape...
 PLEASE ANSWER!!!!!!!!
Use scratch paper as needed. Be sure to label the answer if it is written on the scratch paper. Q1. (20 POINTS) The following are the sales figures for your company for the past 6 years. Use the exponential smoothing method and moving average to smooth the data and provide the forecast for 2013. Also find the MAPE for the series. Which of the two values of alpha yields the best results? Show all calculations Forecasted Sales Sales...
PLEASE ANSWER!!!!!!!!
Use scratch paper as needed. Be sure to label the answer if it is written on the scratch paper. Q1. (20 POINTS) The following are the sales figures for your company for the past 6 years. Use the exponential smoothing method and moving average to smooth the data and provide the forecast for 2013. Also find the MAPE for the series. Which of the two values of alpha yields the best results? Show all calculations Forecasted Sales Sales...
Prepare weekly forecasts for week 15 for each product using Moving Average forecasting technique using a...
Prepare weekly forecasts for week 15 for each product using Moving Average forecasting technique using a 2 -6 period moving average. Then use error analysis or forecast accuracy techniques for the 2 - 6 period moving averages. Week Product 1 Product 2 1 50 40 2 54 38 3 57 41 4 60 46 5 64 42 6 67 41 7 90 41 8 76 47 9 79 42 10 82 43 11 85 42 12 87 49 13 92...
1.Please use the Hawkins sheet. What is the MFE , MAE , MSE , an...
 1.Please use the Hawkins sheet.
What is the MFE , MAE , MSE ,
and MAPE for a three-month moving average
forecast? Round to two decimal places.
2.Please use the Hawkins sheet.
What is the MFE , MAE , MSE ,
and MAPE for the exponential smoothing forecast with
alpha = 0.2? Round to two decimal places.
3.Please use the Hawkins sheet.
Based on the MSE values found in Questions 1 & 2, which
forecast is best?
------------------------------------------------------------------
Thank you...
1.Please use the Hawkins sheet.
What is the MFE , MAE , MSE ,
and MAPE for a three-month moving average
forecast? Round to two decimal places.
2.Please use the Hawkins sheet.
What is the MFE , MAE , MSE ,
and MAPE for the exponential smoothing forecast with
alpha = 0.2? Round to two decimal places.
3.Please use the Hawkins sheet.
Based on the MSE values found in Questions 1 & 2, which
forecast is best?
------------------------------------------------------------------
Thank you...
 The manager of a travel agency asked you to come up with a forecasting technique that will best fit to the actual demand for packaged tours. You have observed and recorded the actual demand for the last 10 periods. You also identified two possible techniques for consideration: 2-month moving averages (F1), and exponential smoothing (F2) with a smoothing constant of 0.40. Using Cumulathve Forecasting Erro (CFE) and Mean Absolute Daviation (MAD) as your performance measures you will detarmine tha technique...
 Complete PART (b) ONLY. Please use answer from Part
(a). Please complete this using EXCEL; SHow the steps/ excel
calculations.
Month
Actual Demand
1
62
2
65
3
67
4
68
5
71
6
73
7
76
8
78
9
78
10
80
11
84
12
85
part (a)
MY answer to Part (a):
Part (b)
(b) Now calculate all the measures of
forecasting accuracy listed below for the single exponential
smoothing forecast completed in part (a)
-i) MAPE (Mean...
Complete PART (b) ONLY. Please use answer from Part
(a). Please complete this using EXCEL; SHow the steps/ excel
calculations.
Month
Actual Demand
1
62
2
65
3
67
4
68
5
71
6
73
7
76
8
78
9
78
10
80
11
84
12
85
part (a)
MY answer to Part (a):
Part (b)
(b) Now calculate all the measures of
forecasting accuracy listed below for the single exponential
smoothing forecast completed in part (a)
-i) MAPE (Mean...
 You are an operation manager at Gambas Berhad. You plan to use several forecasting methods for the purpose. The following data represent the actual monthly company sales for 2018. Month Value (RM000 32 41 53 59 46 31 27 24 10 35 54 105 Ja March ril un August ber November December (a) Calculate the Mean Absolute Deviation (MAD) and make a forecast for January 2019 sales based on the following methods: i. 4-month moving average. (5 marks) i. Weighted...
 Homework #6 NAME: (State numerical answers #1 Use the leffersonCommunityCollege data set to answer the following questions. #1.1 The 3-period Moving Average forecast for Period 10 is #1.2 The 5-period Moving Average forecast for Period 10 is The MSE, MAE, and MAPE scores for the 3-period and 5-period Moving Average models are: Section: 9:30 12:30 Also put your name on the top of the back of the page Circle one. to four decimal places) 3-period Moving Average S-period Moving Average...
 H.W 13 Q5
QUESTION 5 The manager of a travel agency asked you to come up with a forecasting technique that will best fit to the actual demand for packaged tours. You have observed and recorded the actual demand for the last 10 periods. You also identified two possible techniques for consideration: 2-month moving averages (F1), and exponential smoothing (F2) with a smoothing constant of 0.35. Using Cumulative Forecasting Error (CFE) and Mean Absolute Deviation (MAD) as your performance measures...
H.W 13 Q5
QUESTION 5 The manager of a travel agency asked you to come up with a forecasting technique that will best fit to the actual demand for packaged tours. You have observed and recorded the actual demand for the last 10 periods. You also identified two possible techniques for consideration: 2-month moving averages (F1), and exponential smoothing (F2) with a smoothing constant of 0.35. Using Cumulative Forecasting Error (CFE) and Mean Absolute Deviation (MAD) as your performance measures...
 PLEASE ANSWER!!!!!!!!
Use scratch paper as needed. Be sure to label the answer if it is written on the scratch paper. Q1. (20 POINTS) The following are the sales figures for your company for the past 6 years. Use the exponential smoothing method and moving average to smooth the data and provide the forecast for 2013. Also find the MAPE for the series. Which of the two values of alpha yields the best results? Show all calculations Forecasted Sales Sales...
PLEASE ANSWER!!!!!!!!
Use scratch paper as needed. Be sure to label the answer if it is written on the scratch paper. Q1. (20 POINTS) The following are the sales figures for your company for the past 6 years. Use the exponential smoothing method and moving average to smooth the data and provide the forecast for 2013. Also find the MAPE for the series. Which of the two values of alpha yields the best results? Show all calculations Forecasted Sales Sales...
 1.Please use the Hawkins sheet.
What is the MFE , MAE , MSE ,
and MAPE for a three-month moving average
forecast? Round to two decimal places.
2.Please use the Hawkins sheet.
What is the MFE , MAE , MSE ,
and MAPE for the exponential smoothing forecast with
alpha = 0.2? Round to two decimal places.
3.Please use the Hawkins sheet.
Based on the MSE values found in Questions 1 & 2, which
forecast is best?
------------------------------------------------------------------
Thank you...
1.Please use the Hawkins sheet.
What is the MFE , MAE , MSE ,
and MAPE for a three-month moving average
forecast? Round to two decimal places.
2.Please use the Hawkins sheet.
What is the MFE , MAE , MSE ,
and MAPE for the exponential smoothing forecast with
alpha = 0.2? Round to two decimal places.
3.Please use the Hawkins sheet.
Based on the MSE values found in Questions 1 & 2, which
forecast is best?
------------------------------------------------------------------
Thank you...
Most questions answered within 3 hours.
-
Where is the error in this code sequence?
String s1 = "Hello";
String s2 = "ello";...
asked 10 months ago -
Financial data for Joel de Paris, Inc., for last year
follow:
Joel de Paris, Inc.
Balance...
asked 10 months ago -
Consider this reaction:
Al2(SO4)3 (aq)+ BaCl3
(aq) Al2Cl6 (aq)- +
3BaSO4(s) . What is the...
asked 10 months ago -
Suppose that Savneet is considering increasing her
recent random sample from 20 car rentals to 40...
asked 10 months ago -
Trucks arrive at an unloading terminal at an average rate of 120
per hour.
Trucks arrive...
asked 10 months ago -
Why are methanol and ethanol completely soluble in water while
octanol is not very little soluble....
asked 10 months ago -
A facilities manager at a university reads in a research report
that the mean amount of...
asked 10 months ago -
When the CuSO4 is rehydrated by adding water to the anhydrous
compound, is this an endothermic...
asked 10 months ago -
A ray of sunlight is passing from diamond into crown glass; the
angle of incidence is...
asked 10 months ago -
A block of mass 0.249 kg is placed on top of a light, vertical
spring of...
asked 10 months ago -
how do the kidneys compensate in the presences of acidosis
a) trigger hyperventilate
b) reserve acid...
asked 10 months ago -
Question 501 pts
The rental rate of capital to the firm increases. Which of the
following...
asked 10 months ago