


4. Comparing models Based on all models run, which model do you feel best predicts future trends? Explain your rationale. Based on the model selected, what type of seasonal adjustments,if any, would be required to meet customer needs? a. b.
26 27 28 29 30 31 32 33 34 35 36 37 38 39 40 41 42 43 44 5 6 7 8 49 50 5 5 5 54 55 56 57 58 59 6 6 6 6 6 65 66 67 68 69
2 2 0123456
Homework Answers


Add Answer to:
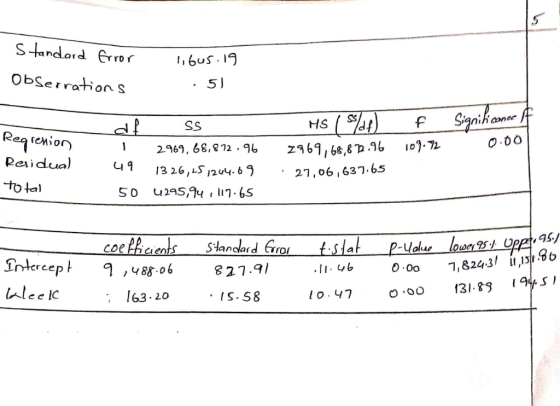
The first two are the instructions to the assignment and the last two are the data
WalMart’s fiscal year starts the first week of February. This means that when analyzing the data,...
WalMart’s fiscal year starts the first week of February. This means that when analyzing the data, week 26 is actually week 30 (26+4 weeks for January) in 2002 or the end of July 2002. Also, week 52 is actually week 4 (52+4 weeks for January 2002 minus 52 weeks for 2002) in 2003 or the end of January 2003. As an example, the spike in sales (revenue) at week 75 occurs in week 27 (75+4 weeks for January 2002 minus...
Note that WalMart’s fiscal year starts the first week of February. This means that when analyzing...
Note that WalMart’s fiscal year starts the first week of February. This means that when analyzing the data, week 26 is actually week 30 (26+4 weeks for January) in 2002 or the end of July 2002. Also, week 52 is actually week 4 (52+4 weeks for January 2002 minus 52 weeks for 2002) in 2003 or the end of January 2003. Outliers (extreme values) are present in the data and can distort modeling results. As an example, spikes in sales...
Note that WalMart’s fiscal year starts the first week of February.
Note that WalMart’s fiscalyear starts the first week of February. This means that when analyzing the data, week 26 is actuallyweek 30 (26+4 weeks for January) in 2002 or the end of July 2002. Also, week 52 is actually week 4(52+4 weeks for January 2002 minus 52 weeks for 2002) in 2003 or the end of January 2003. Outliers(extreme values) are present in the data and can distort modeling results. As an example, spikes in sales(revenue) at weeks 28-30 occurs...
The WalMart’s fiscal year starts the first week of February. This means that when analyzing the...
The WalMart’s fiscal year starts the first week of February. This means that when analyzing the data, week 26 is actually week 30 (26+4 weeks for January) in 2002 or the end of July 2002. Also, week 52 is actually week 4 (52+4 weeks for January 2002 minus 52 weeks for 2002) in 2003 or the end of January 2003. As an example, the spike in sales (revenue) at week 75 occurs in week 27 (75+4 weeks for January 2002...
The WalMart’s fiscal year starts the first week of February. This means that when analyzing the d...
The WalMart’s fiscal year starts the first week of February. This means that when analyzing the data, week 26 is actually week 30 (26+4 weeks for January) in 2002 or the end of July 2002. Also, week 52 is actually week 4 (52+4 weeks for January 2002 minus 52 weeks for 2002) in 2003 or the end of January 2003. As an example, the spike in sales (revenue) at week 75 occurs in week 27 (75+4 weeks for January 2002...
Project #2 Wal*Mart Dry Goods Sales 2003-2004 The following items are a guide for responses to be addressed in project two. Note that WalMart’s fiscal year starts the first week of February. This means that when analyzing the data, week 41 is actually w
Project #2Wal*Mart Dry Goods Sales 2003-2004The following items are a guide for responses to be addressed in project two. Note that WalMart’s fiscal year starts the first week of February. This means that when analyzing the data, week 41 is actually week 45 (41+4 weeks for January) in 2003 or the beginning of November 2003. Also, week 52 is actually week 4 (52+4 weeks for January 2003 minus 52 weeks for 2003) in 2004 or the end of January 2004. ...
Week Sales 26 15200 27 15600 28 16400 29 15600 30 14200 31 14400 32 16400 33 15200 34 14400 35 13...
Week Sales 26 15200 27 15600 28 16400 29 15600 30 14200 31 14400 32 16400 33 15200 34 14400 35 13800 36 15000 37 14100 38 14400 39 14000 40 15600 41 15000 42 14400 43 17800 44 15000 45 15200 46 15800 47 18600 48 15400 49 15500 50 16800 51 18700 52 21400 53 20900 54 18800 55 22400 56 19400 57 20000 58 18100 59 18000 60 19600 61 19000 62 19200 63 18000 64 17600...
My last question has gone hours without being answered, so I am submitting these again. Anyone wh...
 My last question has gone hours without being answered, so I
am submitting these again. Anyone who could help with these 10
questions would be MASSIVELY appreciated. Thank you!!
11. Find the y-intercept of the equation of the least-squares regression line for the dataset in the table. (1 poins x y 1 15 6 18 7 18 15 24 16 23 22 26 23 27 28 30 33 32 0.52 1.91 15.14 -23.91 12. For the data in the table,...
My last question has gone hours without being answered, so I
am submitting these again. Anyone who could help with these 10
questions would be MASSIVELY appreciated. Thank you!!
11. Find the y-intercept of the equation of the least-squares regression line for the dataset in the table. (1 poins x y 1 15 6 18 7 18 15 24 16 23 22 26 23 27 28 30 33 32 0.52 1.91 15.14 -23.91 12. For the data in the table,...
5. A company has recorded data on the weekly sales for its product (y) and the...
 5. A company has recorded data on the weekly sales for its product (y) and the unit price of the competitor's product (x). The data resulting from a random sample of 7 weeks is on the data sheet. Use Excel to develop a scatter diagram and to compute the least squares estimated regression equation and the coefficient of determination (R2). Week Sales 1 2 3 Price 0.33 0.25 0.44 0.4 0.35 0.39 0.29 4 20 14 22 21 16 19...
Please explain the steps that need to be taken in Excel in order to complete the questions.
 Please explain the steps that need to be taken in Excel in order
to complete the questions.
Wal-Mart Revenue: Case Study One Wal-Mart is the second largest retailer in the world. The data file (WalMart_revenue.xlsx) is included in the Excel data zip file in week one, and it holds monthly data on Wal-Mart's revenue, along with several possibly related economic variables. (a) Develop a linear regression model to predict Wal-Mart revenue, using CPI as the only (b) Develop a linear...
Please explain the steps that need to be taken in Excel in order
to complete the questions.
Wal-Mart Revenue: Case Study One Wal-Mart is the second largest retailer in the world. The data file (WalMart_revenue.xlsx) is included in the Excel data zip file in week one, and it holds monthly data on Wal-Mart's revenue, along with several possibly related economic variables. (a) Develop a linear regression model to predict Wal-Mart revenue, using CPI as the only (b) Develop a linear...
 My last question has gone hours without being answered, so I
am submitting these again. Anyone who could help with these 10
questions would be MASSIVELY appreciated. Thank you!!
11. Find the y-intercept of the equation of the least-squares regression line for the dataset in the table. (1 poins x y 1 15 6 18 7 18 15 24 16 23 22 26 23 27 28 30 33 32 0.52 1.91 15.14 -23.91 12. For the data in the table,...
My last question has gone hours without being answered, so I
am submitting these again. Anyone who could help with these 10
questions would be MASSIVELY appreciated. Thank you!!
11. Find the y-intercept of the equation of the least-squares regression line for the dataset in the table. (1 poins x y 1 15 6 18 7 18 15 24 16 23 22 26 23 27 28 30 33 32 0.52 1.91 15.14 -23.91 12. For the data in the table,...
 5. A company has recorded data on the weekly sales for its product (y) and the unit price of the competitor's product (x). The data resulting from a random sample of 7 weeks is on the data sheet. Use Excel to develop a scatter diagram and to compute the least squares estimated regression equation and the coefficient of determination (R2). Week Sales 1 2 3 Price 0.33 0.25 0.44 0.4 0.35 0.39 0.29 4 20 14 22 21 16 19...
 Please explain the steps that need to be taken in Excel in order
to complete the questions.
Wal-Mart Revenue: Case Study One Wal-Mart is the second largest retailer in the world. The data file (WalMart_revenue.xlsx) is included in the Excel data zip file in week one, and it holds monthly data on Wal-Mart's revenue, along with several possibly related economic variables. (a) Develop a linear regression model to predict Wal-Mart revenue, using CPI as the only (b) Develop a linear...
Please explain the steps that need to be taken in Excel in order
to complete the questions.
Wal-Mart Revenue: Case Study One Wal-Mart is the second largest retailer in the world. The data file (WalMart_revenue.xlsx) is included in the Excel data zip file in week one, and it holds monthly data on Wal-Mart's revenue, along with several possibly related economic variables. (a) Develop a linear regression model to predict Wal-Mart revenue, using CPI as the only (b) Develop a linear...
Most questions answered within 3 hours.
-
Where is the error in this code sequence?
String s1 = "Hello";
String s2 = "ello";...
asked 10 months ago -
Financial data for Joel de Paris, Inc., for last year
follow:
Joel de Paris, Inc.
Balance...
asked 10 months ago -
Consider this reaction:
Al2(SO4)3 (aq)+ BaCl3
(aq) Al2Cl6 (aq)- +
3BaSO4(s) . What is the...
asked 10 months ago -
Suppose that Savneet is considering increasing her
recent random sample from 20 car rentals to 40...
asked 10 months ago -
Trucks arrive at an unloading terminal at an average rate of 120
per hour.
Trucks arrive...
asked 10 months ago -
Why are methanol and ethanol completely soluble in water while
octanol is not very little soluble....
asked 10 months ago -
A facilities manager at a university reads in a research report
that the mean amount of...
asked 10 months ago -
When the CuSO4 is rehydrated by adding water to the anhydrous
compound, is this an endothermic...
asked 10 months ago -
A ray of sunlight is passing from diamond into crown glass; the
angle of incidence is...
asked 10 months ago -
A block of mass 0.249 kg is placed on top of a light, vertical
spring of...
asked 10 months ago -
how do the kidneys compensate in the presences of acidosis
a) trigger hyperventilate
b) reserve acid...
asked 10 months ago -
Question 501 pts
The rental rate of capital to the firm increases. Which of the
following...
asked 10 months ago