

a search this course SAGE MINDTAP Using a an esti ated regression equation for the data of the form y bg + bız + bg2 Comment on the adequacy of this equation for predicting y Enter negative value as negative number, if your answer is zero, enter "0' x + x2 (to 2 decimals) R-sq adj- (to 1 decimal) p-value (to 4 decimals) SOURCE DF MS (to 3 decimals) (to 3 decimais) (to 2 decimals) Regression | Residual Error Total % (to 1 decimal) of the variability in y has been explained by z. (to 2 decimals) Check My Work (3 remaining)
Homework Answers
a.
Step 1 - Put the data in excel as shown and arrange the variables as shown
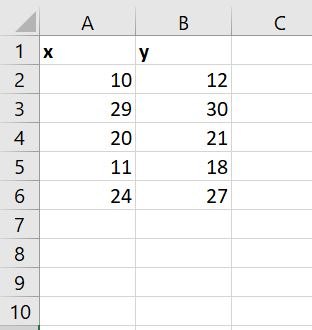
Step 2 - Since we need to predict y
The dependent variable is y
The independent variable is x
Step 3 - Select the regression option from the data analysis tab

Step 4 - Input the values as shown below.

Step 5 - The output is generated as follows.

Regession equation ( highlighted in yellow)
y = 5.9379 + 0.833 x
s = 2.3983 ( highlighted in blue)
rsqure = 0.9159 (highlighted in green)
r sq adjusted = 0.8878
anova
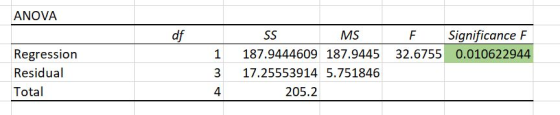
Using the 0.05 significance level, the pvalue indicates a high significance , note the 91 % of the variablity in y has been explained by x.
b.
Step 1 - Put the data in excel as shown, also create x2 and arrange the variables as shown

Step 2 - Since we need to predict y
The dependent variable is y
The independent variable is x, x2
Step 3 - Select the regression option from the data analysis tab

Step 4 - Input the values as shown below.

Step 5 - The output is generated as follows.
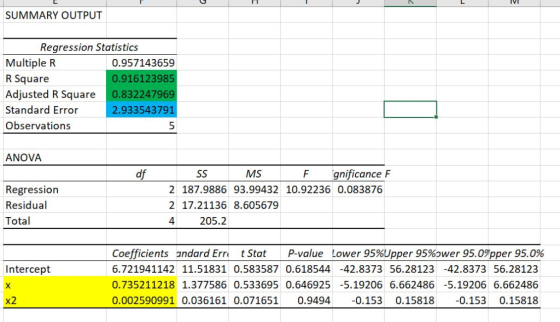
Regession equation ( highlighted in yellow)
y= 6.7219 +0.7352 x +0.0025 x2
s = 2.9335 ( highlighted in blue)
rsqure = 0.9161 (highlighted in green)
r sq adjusted = 0.8322
anova
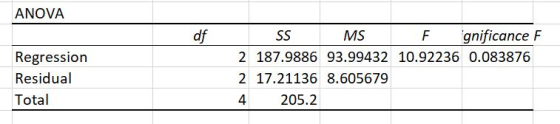
Using the 0.05 significance level, the pvalue indicates a no significance , note the 91 % of the variablity in y has been explained by x.
c.
Since the only the first model is signficant, we will use the first regression equation to predict.
y = 5.9379 + 0.833 x
y = 5.9379 + 0.833 (17) = 20.1004
Add Answer to:
Course NGAGE MINDTAP z and y. z | 10 220 11 24 12 30 21 18 27 equation for the data of the form b...
Given are five observations for two variables, x and y. 4 8 12 16 18 yi...
 Given are five observations for two variables, x and y. 4 8 12 16 18 yi 58 51 48 14 15 The estimated regression equation for these data is y= 76.77 - 3.41x a. Compute SSE, SST, and SSR (to 2 SSE decimals) (to 2 SST decimals) (to 2 SSR decimals) b. Compute the coefficient of determination r. Comment on the goodness of fit (to 3 decimals) % of the variability in y has been explained by the estimated regression...
Consider the following data for two variables, x and y. (a) Develop an estimated regression equation...
 Consider the following data for two variables, x and y. (a) Develop an estimated regression equation for the data of the form ý = bo + 5,x. (Round bo to two decimal places and b, to three decimal places.) Comment on the adequacy of this equation for predicting y. (Use a = 0.05.) The high p-value and low coefficient of determination indicate that the equation is inadequate. The high p-value and high coefficient of determination indicate that the equation is...
Risk Age Blood Pressure Smoker 10 59 220 1 33 67 129 0 14 68 170...
 Risk
Age
Blood Pressure
Smoker
10
59
220
1
33
67
129
0
14
68
170
0
59
63
198
0
30
65
173
0
52
74
172
1
9
77
159
0
28
73
173
0
32
68
117
1
20
80
209
1
40
62
176
1
41
82
110
0
25
67
151
1
56
55
191
0
36
61
208
1
32
61
112
1
26
78
125
0
28
75
129
0
18
90
184...
Risk
Age
Blood Pressure
Smoker
10
59
220
1
33
67
129
0
14
68
170
0
59
63
198
0
30
65
173
0
52
74
172
1
9
77
159
0
28
73
173
0
32
68
117
1
20
80
209
1
40
62
176
1
41
82
110
0
25
67
151
1
56
55
191
0
36
61
208
1
32
61
112
1
26
78
125
0
28
75
129
0
18
90
184...
Suppose that we want to find a regression equation relating systolic blood pressure (y) to weight...
Suppose that we want to find a regression equation relating systolic blood pressure (y) to weight (x1), age (x2) and smoking status (0 = does not smoke, 1 = smokes less than one pack per day, 2 = smokes one or more packs per day). Use the Minitab outputs below to test whether or not the smoking status variable adds to the predictive value of a model which already contains weight and age, using α = .05. i.e., test the...
x1 6 11 15 18 20 y1 6 8 12 20 30 Compute b1 and b0...
x1 6 11 15 18 20 y1 6 8 12 20 30 Compute b1 and b0 (to 3 decimals). Enter negative values as negative numbers. b1 b0 Complete the estimated regression equation (to 3 decimals). Enter negative values as negative numbers. y^ = ____ + _____ x x1 x2 x3 x4 x5 Compute the standardized residuals. Enter negative values as negative numbers. standardized residual 1 (to 4 decimal places) 2 (to 4 decimal places) 3 (to 4 decimal places) 4...
x:12 21 28 8 20 y:17 15 22 19 24 1. What is the value of...
x:12 21 28 8 20 y:17 15 22 19 24 1. What is the value of b1? 2. What is the value of b0? 3. What is the equation of the y ^ estimator line? 4.if x is increased by 10 units, how much does y ^ change? 5.Assume b0 = 12.953, and b1 = -2.5. For x = 25, predict y 6. How much correlation is there between x and y? Round to four decimals and use leading zeros...
CENGAGE | MINDTAP Q Search this course Julia Chapter 16 Assignment A highway department is studying...
 CENGAGE | MINDTAP Q Search this course Julia Chapter 16 Assignment A highway department is studying the relationship between traffic flow and speed. The following model has been hypothesized. y = Bo+ B 1x + B 2x2 + € where y = traffic flow in vehicles per hour x = vehicle speed in miles per hour The following data were collected during rush hour for six highways leading out of the city. Traffic Flow (y) Vehicle Speed (x) 1,257 1,329...
' - [2 marks] Suppose that we want to find a regression equation relating systolic blood...
 '
- [2 marks] Suppose that we want to find a regression equation relating systolic blood pressure (v) to weight (x1), age (x2) and smoking status (0 = does not smoke, 1 = smokes less than one pack per day, 2 = smokes one or more packs per day). Use the Minitab outputs below to test whether or not the smoking status variable adds to the predictive value of a model which already contains weight and age, using a =...
'
- [2 marks] Suppose that we want to find a regression equation relating systolic blood pressure (v) to weight (x1), age (x2) and smoking status (0 = does not smoke, 1 = smokes less than one pack per day, 2 = smokes one or more packs per day). Use the Minitab outputs below to test whether or not the smoking status variable adds to the predictive value of a model which already contains weight and age, using a =...
Consider the following data for a dependent variable y and two independent variables, 11 and 12. 175 117 14...
 Consider the following data for a dependent variable y and two independent variables, 11 and 12. 175 117 142 211 3 142 211 Round your all answers to two decimal places. Enter negative values as negative numbers, if necessary. a. Develop an estimated regression equation relating y to 1. = Predict y if x1 = 35. y = b. Develop an estimated regression equation relating y to 22. Predict y if 22 = 15. c. Develop an estimated regression equation...
A 10-year study conducted by the American Heart Association provided data on how age, blood pressure,...
A 10-year study conducted by the American Heart Association provided data on how age, blood pressure, and smoking relate to the risk of strokes. Data from a portion of this study follow. Risk is interpreted as the probability (times 100) that a person will have a stroke over the next 10-year period. For the smoker variable, 1 indicates a smoker and 0 indicates a nonsmoker. Risk Age Blood Pressure Smoker 14 58 201 0 23 82 98 1 25 74...
 Given are five observations for two variables, x and y. 4 8 12 16 18 yi 58 51 48 14 15 The estimated regression equation for these data is y= 76.77 - 3.41x a. Compute SSE, SST, and SSR (to 2 SSE decimals) (to 2 SST decimals) (to 2 SSR decimals) b. Compute the coefficient of determination r. Comment on the goodness of fit (to 3 decimals) % of the variability in y has been explained by the estimated regression...
 Consider the following data for two variables, x and y. (a) Develop an estimated regression equation for the data of the form ý = bo + 5,x. (Round bo to two decimal places and b, to three decimal places.) Comment on the adequacy of this equation for predicting y. (Use a = 0.05.) The high p-value and low coefficient of determination indicate that the equation is inadequate. The high p-value and high coefficient of determination indicate that the equation is...
 Risk
Age
Blood Pressure
Smoker
10
59
220
1
33
67
129
0
14
68
170
0
59
63
198
0
30
65
173
0
52
74
172
1
9
77
159
0
28
73
173
0
32
68
117
1
20
80
209
1
40
62
176
1
41
82
110
0
25
67
151
1
56
55
191
0
36
61
208
1
32
61
112
1
26
78
125
0
28
75
129
0
18
90
184...
Risk
Age
Blood Pressure
Smoker
10
59
220
1
33
67
129
0
14
68
170
0
59
63
198
0
30
65
173
0
52
74
172
1
9
77
159
0
28
73
173
0
32
68
117
1
20
80
209
1
40
62
176
1
41
82
110
0
25
67
151
1
56
55
191
0
36
61
208
1
32
61
112
1
26
78
125
0
28
75
129
0
18
90
184...
 CENGAGE | MINDTAP Q Search this course Julia Chapter 16 Assignment A highway department is studying the relationship between traffic flow and speed. The following model has been hypothesized. y = Bo+ B 1x + B 2x2 + € where y = traffic flow in vehicles per hour x = vehicle speed in miles per hour The following data were collected during rush hour for six highways leading out of the city. Traffic Flow (y) Vehicle Speed (x) 1,257 1,329...
 '
- [2 marks] Suppose that we want to find a regression equation relating systolic blood pressure (v) to weight (x1), age (x2) and smoking status (0 = does not smoke, 1 = smokes less than one pack per day, 2 = smokes one or more packs per day). Use the Minitab outputs below to test whether or not the smoking status variable adds to the predictive value of a model which already contains weight and age, using a =...
'
- [2 marks] Suppose that we want to find a regression equation relating systolic blood pressure (v) to weight (x1), age (x2) and smoking status (0 = does not smoke, 1 = smokes less than one pack per day, 2 = smokes one or more packs per day). Use the Minitab outputs below to test whether or not the smoking status variable adds to the predictive value of a model which already contains weight and age, using a =...
 Consider the following data for a dependent variable y and two independent variables, 11 and 12. 175 117 142 211 3 142 211 Round your all answers to two decimal places. Enter negative values as negative numbers, if necessary. a. Develop an estimated regression equation relating y to 1. = Predict y if x1 = 35. y = b. Develop an estimated regression equation relating y to 22. Predict y if 22 = 15. c. Develop an estimated regression equation...
Most questions answered within 3 hours.
-
Where is the error in this code sequence?
String s1 = "Hello";
String s2 = "ello";...
asked 11 months ago -
Financial data for Joel de Paris, Inc., for last year
follow:
Joel de Paris, Inc.
Balance...
asked 11 months ago -
Consider this reaction:
Al2(SO4)3 (aq)+ BaCl3
(aq) Al2Cl6 (aq)- +
3BaSO4(s) . What is the...
asked 11 months ago -
Suppose that Savneet is considering increasing her
recent random sample from 20 car rentals to 40...
asked 11 months ago -
Trucks arrive at an unloading terminal at an average rate of 120
per hour.
Trucks arrive...
asked 11 months ago -
Why are methanol and ethanol completely soluble in water while
octanol is not very little soluble....
asked 11 months ago -
A facilities manager at a university reads in a research report
that the mean amount of...
asked 11 months ago -
When the CuSO4 is rehydrated by adding water to the anhydrous
compound, is this an endothermic...
asked 11 months ago -
A ray of sunlight is passing from diamond into crown glass; the
angle of incidence is...
asked 11 months ago -
A block of mass 0.249 kg is placed on top of a light, vertical
spring of...
asked 11 months ago -
how do the kidneys compensate in the presences of acidosis
a) trigger hyperventilate
b) reserve acid...
asked 11 months ago -
Question 501 pts
The rental rate of capital to the firm increases. Which of the
following...
asked 11 months ago