
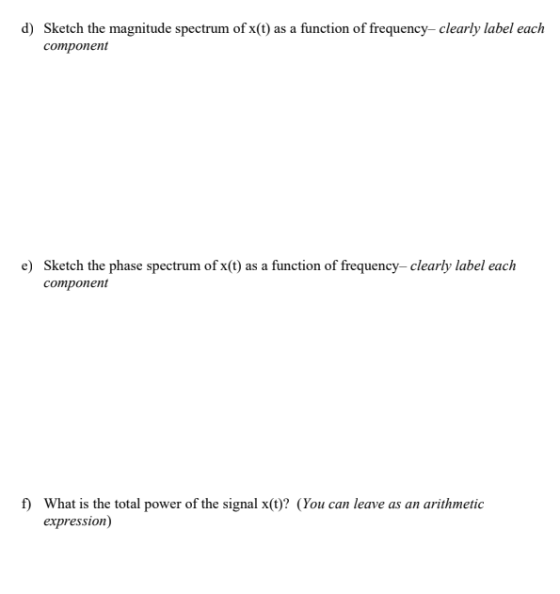
d) Sketch the magnitude spectrum of x(t) as a function of frequency-clearly label each component Sketch the phase spectrum of x(t) as a function of frequency-clearly label each component e) f What is the total power of the signal x()? (You can leave as an arithmetic expression)
Homework Answers
Add Answer to:
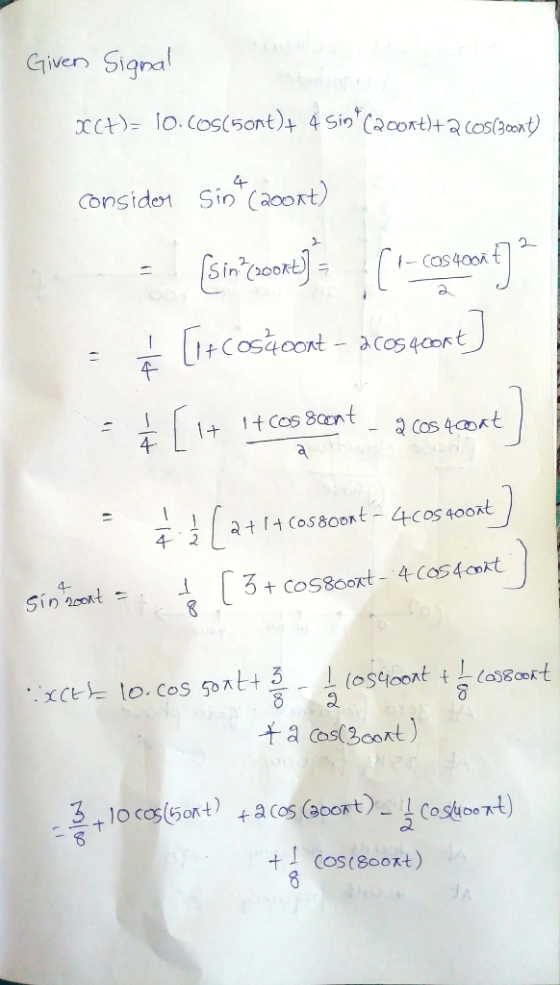
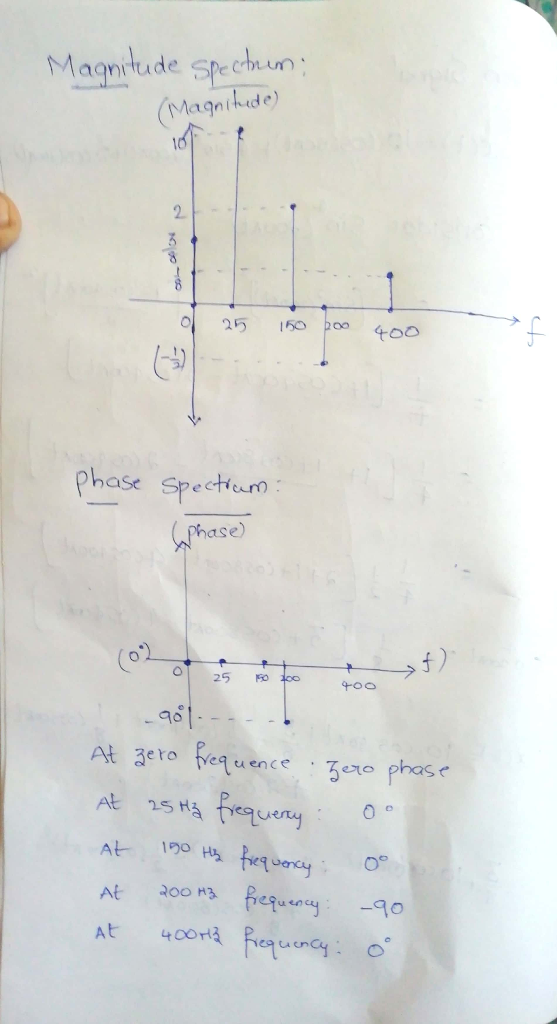
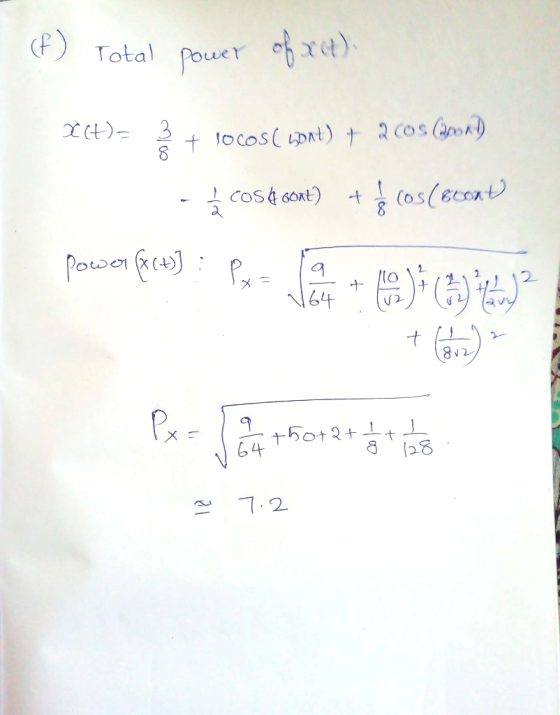
X(t)-1 0cos (50π t) + 4sin4(200π t)+2cos(300π t) d) Sketch the magnitude spectrum of x(t) as a ...
Sketch the frequency spectrum of he following signal and indicate the complex magnitude of each. All...
 Sketch the frequency spectrum of he following signal and
indicate the complex magnitude of each. All amplitudes must be
positive
Determine fundamental frequency and period
*all phases need to be written in terms of pi between
-pi and pi.
Sketch the frequency spectrum of the following signal and indicate the complex magnitude of each frequency component Manipulate phase as necessary to plot all components of the spectrum with positive amplitudes: x(t) = 14 cos( 1 60mt-π/4) + 5 cos(280mt-2π/3) -cos(600πt...
Sketch the frequency spectrum of he following signal and
indicate the complex magnitude of each. All amplitudes must be
positive
Determine fundamental frequency and period
*all phases need to be written in terms of pi between
-pi and pi.
Sketch the frequency spectrum of the following signal and indicate the complex magnitude of each frequency component Manipulate phase as necessary to plot all components of the spectrum with positive amplitudes: x(t) = 14 cos( 1 60mt-π/4) + 5 cos(280mt-2π/3) -cos(600πt...
1. Given a baseband signal m(t) sin(1000mt) cos(3000nt) + cos(3700nt a. Sketch the spectrum of m(...
 1. Given a baseband signal m(t) sin(1000mt) cos(3000nt) + cos(3700nt a. Sketch the spectrum of m(t) (Hint. sin(a) cos(b) 0.5 sin(a +b) +0.5sin a-b)) b. Sketch the spectrum of DSB-CS signal m(t)cos(10000mt) C ldentify the upper sideband {USB) and lower sideband (LSB) spectra d. Give the black diagram of the receiver to receive DSB-CS signal in (b). 2. baseband signal m(r)--0.5 + Σ..小(t-n)-u(t-0.5-n)] where ult) is the Given unit step function, an amplitude modulated signal is as SAM 107+ m(0cos...
(a) Sketch the spectrum of the signal r(t). Show the spectrum as a function of f...
 (a) Sketch the spectrum of the signal r(t). Show the spectrum as a function of f in Hz For the rest of this problem, assume that the signal is sampled at a rate of fs 50 Hz. (b) Sketch the spectrum for the sampled signal rn). Your spectrum should be shown as a function of the normalized frequency over the interval-2π < -+2T. c) Write an equation for the sampled signal [n. (d) Suppose that the signal is reconstructed from...
2. [20 points] The carrier c(t-Acce(2106 t) is frequency modulated by the sinusoid signal m(t) 2cos...
 2. [20 points] The carrier c(t-Acce(2106 t) is frequency modulated by the sinusoid signal m(t) 2cos (2000mt). The deviation constant is kr 3000 Hz/V Determine the bandwidth of the modulated signal using Carson's rule a. Sketch the magnitude of the spectrum of the modulated signal (plot only those frequency components that lie within the bandwidth derived in part a) with detailed information such as the areas of delta function determined by the Bessel function, frequency separation between each spectrum (note...
Signal: x(t) = 2cos(3πt) Sketch the signal. Please make sure to label all relevant features.
Signal: x(t) = 2cos(3πt) Sketch the signal. Please make sure to label all relevant features.
(1) Consider the following continuous-time signal: (1) 2ua(-t+t)ua(t), where its energy is 20 milli Joules (2...
 (1) Consider the following continuous-time signal: (1) 2ua(-t+t)ua(t), where its energy is 20 milli Joules (2 x 10³Joules). The signal ra(t) is sampled at a rate of 500 samples/sec to yield its discrete-time counter part (n) (a) Find ti, and hence sketch ra(t). (b) From part (a), plot r(n) and finds its energy (c) Derive an expression for the Fourier transform of a(n), namely X(ew). (d) Plot the magnitude spectrum (1X(e)) and phase spectrum 2(X(e). (e) Consider the signal y(n)...
2.5. Given an analog signal x(t)5cos(2T 2, 5001) + 2cos(2T 4, 5001), for t2 0 sampled...
 2.5. Given an analog signal x(t)5cos(2T 2, 5001) + 2cos(2T 4, 5001), for t2 0 sampled at a rate of 8,000 Hz, a. sketch the spectrum of the sampled signal up to 20 kHz; b. sketch the recovered analog signal spectrum if an ideal lowpass filter with a cutoff frequency of 4 kHz is used to filter the sampled signal in order to recover the original signal; c. determine the frequneuencis f aliasing noise.
4. Find the Nyquist rate for the following signals. For each case sketch the magnitude spectrum...
 4. Find the Nyquist rate for the following signals. For each case sketch the magnitude spectrum of the sampled signal if the sampling rate is 25% higher than the Nyquist rate. a.) ft)sinc E 2T 10 b.) h)=sinc 2T For all the following, use ft) given in part a.) c.) glt)= f(l-7) d.) c(t)- f)cos() 1 e.) x(t)= fit)+ _ sinc (t
4. Find the Nyquist rate for the following signals. For each case sketch the magnitude spectrum of the...
4. Find the Nyquist rate for the following signals. For each case sketch the magnitude spectrum of the sampled signal if the sampling rate is 25% higher than the Nyquist rate. a.) ft)sinc E 2T 10 b.) h)=sinc 2T For all the following, use ft) given in part a.) c.) glt)= f(l-7) d.) c(t)- f)cos() 1 e.) x(t)= fit)+ _ sinc (t
4. Find the Nyquist rate for the following signals. For each case sketch the magnitude spectrum of the...
3. The signal continuous time signal re(t)-cos(200t)2cos cos(100t) is sampled at twice the Nyquis...
 3. The signal continuous time signal re(t)-cos(200t)2cos cos(100t) is sampled at twice the Nyquist rate to get the sequence r[n]. (a) Sketch X(e) (b) If y[n] = [4n]. Sketch Y(e'"). (c) Is there any aliasing in the Fourier spectrum of yin]? Why or Why Not? (d) If z [n] = x-1, ketch the DTFT of z[n] (e) Is there any aliasing in the Fourier spectrum of [n]? Why or Why Not?
3. The signal continuous time signal re(t)-cos(200t)2cos cos(100t) is...
3. The signal continuous time signal re(t)-cos(200t)2cos cos(100t) is sampled at twice the Nyquist rate to get the sequence r[n]. (a) Sketch X(e) (b) If y[n] = [4n]. Sketch Y(e'"). (c) Is there any aliasing in the Fourier spectrum of yin]? Why or Why Not? (d) If z [n] = x-1, ketch the DTFT of z[n] (e) Is there any aliasing in the Fourier spectrum of [n]? Why or Why Not?
3. The signal continuous time signal re(t)-cos(200t)2cos cos(100t) is...
Problem 2 (Spectrum of a rectangular signal): In this problem, the amplitude spectrum of the signal 1 or Ot 2 ms x(t)- 0 otherwise is to be analysed (b) Numerical calculation of the spectrum: (i) Us...
 Problem 2 (Spectrum of a rectangular signal): In this problem, the amplitude spectrum of the signal 1 or Ot 2 ms x(t)- 0 otherwise is to be analysed (b) Numerical calculation of the spectrum: (i) Use Matlab to generate and plot a vector containing the sample values of the rectangular signal defined in (2) sampled at f 8kHz. Choose the number N of sample values so that it is a power of 2 and that the signal duration is at...
 Sketch the frequency spectrum of he following signal and
indicate the complex magnitude of each. All amplitudes must be
positive
Determine fundamental frequency and period
*all phases need to be written in terms of pi between
-pi and pi.
Sketch the frequency spectrum of the following signal and indicate the complex magnitude of each frequency component Manipulate phase as necessary to plot all components of the spectrum with positive amplitudes: x(t) = 14 cos( 1 60mt-π/4) + 5 cos(280mt-2π/3) -cos(600πt...
Sketch the frequency spectrum of he following signal and
indicate the complex magnitude of each. All amplitudes must be
positive
Determine fundamental frequency and period
*all phases need to be written in terms of pi between
-pi and pi.
Sketch the frequency spectrum of the following signal and indicate the complex magnitude of each frequency component Manipulate phase as necessary to plot all components of the spectrum with positive amplitudes: x(t) = 14 cos( 1 60mt-π/4) + 5 cos(280mt-2π/3) -cos(600πt...
 1. Given a baseband signal m(t) sin(1000mt) cos(3000nt) + cos(3700nt a. Sketch the spectrum of m(t) (Hint. sin(a) cos(b) 0.5 sin(a +b) +0.5sin a-b)) b. Sketch the spectrum of DSB-CS signal m(t)cos(10000mt) C ldentify the upper sideband {USB) and lower sideband (LSB) spectra d. Give the black diagram of the receiver to receive DSB-CS signal in (b). 2. baseband signal m(r)--0.5 + Σ..小(t-n)-u(t-0.5-n)] where ult) is the Given unit step function, an amplitude modulated signal is as SAM 107+ m(0cos...
 (a) Sketch the spectrum of the signal r(t). Show the spectrum as a function of f in Hz For the rest of this problem, assume that the signal is sampled at a rate of fs 50 Hz. (b) Sketch the spectrum for the sampled signal rn). Your spectrum should be shown as a function of the normalized frequency over the interval-2π < -+2T. c) Write an equation for the sampled signal [n. (d) Suppose that the signal is reconstructed from...
 2. [20 points] The carrier c(t-Acce(2106 t) is frequency modulated by the sinusoid signal m(t) 2cos (2000mt). The deviation constant is kr 3000 Hz/V Determine the bandwidth of the modulated signal using Carson's rule a. Sketch the magnitude of the spectrum of the modulated signal (plot only those frequency components that lie within the bandwidth derived in part a) with detailed information such as the areas of delta function determined by the Bessel function, frequency separation between each spectrum (note...
 (1) Consider the following continuous-time signal: (1) 2ua(-t+t)ua(t), where its energy is 20 milli Joules (2 x 10³Joules). The signal ra(t) is sampled at a rate of 500 samples/sec to yield its discrete-time counter part (n) (a) Find ti, and hence sketch ra(t). (b) From part (a), plot r(n) and finds its energy (c) Derive an expression for the Fourier transform of a(n), namely X(ew). (d) Plot the magnitude spectrum (1X(e)) and phase spectrum 2(X(e). (e) Consider the signal y(n)...
 2.5. Given an analog signal x(t)5cos(2T 2, 5001) + 2cos(2T 4, 5001), for t2 0 sampled at a rate of 8,000 Hz, a. sketch the spectrum of the sampled signal up to 20 kHz; b. sketch the recovered analog signal spectrum if an ideal lowpass filter with a cutoff frequency of 4 kHz is used to filter the sampled signal in order to recover the original signal; c. determine the frequneuencis f aliasing noise.
 4. Find the Nyquist rate for the following signals. For each case sketch the magnitude spectrum of the sampled signal if the sampling rate is 25% higher than the Nyquist rate. a.) ft)sinc E 2T 10 b.) h)=sinc 2T For all the following, use ft) given in part a.) c.) glt)= f(l-7) d.) c(t)- f)cos() 1 e.) x(t)= fit)+ _ sinc (t
4. Find the Nyquist rate for the following signals. For each case sketch the magnitude spectrum of the...
4. Find the Nyquist rate for the following signals. For each case sketch the magnitude spectrum of the sampled signal if the sampling rate is 25% higher than the Nyquist rate. a.) ft)sinc E 2T 10 b.) h)=sinc 2T For all the following, use ft) given in part a.) c.) glt)= f(l-7) d.) c(t)- f)cos() 1 e.) x(t)= fit)+ _ sinc (t
4. Find the Nyquist rate for the following signals. For each case sketch the magnitude spectrum of the...
 3. The signal continuous time signal re(t)-cos(200t)2cos cos(100t) is sampled at twice the Nyquist rate to get the sequence r[n]. (a) Sketch X(e) (b) If y[n] = [4n]. Sketch Y(e'"). (c) Is there any aliasing in the Fourier spectrum of yin]? Why or Why Not? (d) If z [n] = x-1, ketch the DTFT of z[n] (e) Is there any aliasing in the Fourier spectrum of [n]? Why or Why Not?
3. The signal continuous time signal re(t)-cos(200t)2cos cos(100t) is...
3. The signal continuous time signal re(t)-cos(200t)2cos cos(100t) is sampled at twice the Nyquist rate to get the sequence r[n]. (a) Sketch X(e) (b) If y[n] = [4n]. Sketch Y(e'"). (c) Is there any aliasing in the Fourier spectrum of yin]? Why or Why Not? (d) If z [n] = x-1, ketch the DTFT of z[n] (e) Is there any aliasing in the Fourier spectrum of [n]? Why or Why Not?
3. The signal continuous time signal re(t)-cos(200t)2cos cos(100t) is...
 Problem 2 (Spectrum of a rectangular signal): In this problem, the amplitude spectrum of the signal 1 or Ot 2 ms x(t)- 0 otherwise is to be analysed (b) Numerical calculation of the spectrum: (i) Use Matlab to generate and plot a vector containing the sample values of the rectangular signal defined in (2) sampled at f 8kHz. Choose the number N of sample values so that it is a power of 2 and that the signal duration is at...
Most questions answered within 3 hours.
-
Where is the error in this code sequence?
String s1 = "Hello";
String s2 = "ello";...
asked 11 months ago -
Financial data for Joel de Paris, Inc., for last year
follow:
Joel de Paris, Inc.
Balance...
asked 11 months ago -
Consider this reaction:
Al2(SO4)3 (aq)+ BaCl3
(aq) Al2Cl6 (aq)- +
3BaSO4(s) . What is the...
asked 11 months ago -
Suppose that Savneet is considering increasing her
recent random sample from 20 car rentals to 40...
asked 11 months ago -
Trucks arrive at an unloading terminal at an average rate of 120
per hour.
Trucks arrive...
asked 11 months ago -
Why are methanol and ethanol completely soluble in water while
octanol is not very little soluble....
asked 11 months ago -
A facilities manager at a university reads in a research report
that the mean amount of...
asked 11 months ago -
When the CuSO4 is rehydrated by adding water to the anhydrous
compound, is this an endothermic...
asked 11 months ago -
A ray of sunlight is passing from diamond into crown glass; the
angle of incidence is...
asked 11 months ago -
A block of mass 0.249 kg is placed on top of a light, vertical
spring of...
asked 11 months ago -
how do the kidneys compensate in the presences of acidosis
a) trigger hyperventilate
b) reserve acid...
asked 11 months ago -
Question 501 pts
The rental rate of capital to the firm increases. Which of the
following...
asked 11 months ago