Homework Answers
Add Answer to:
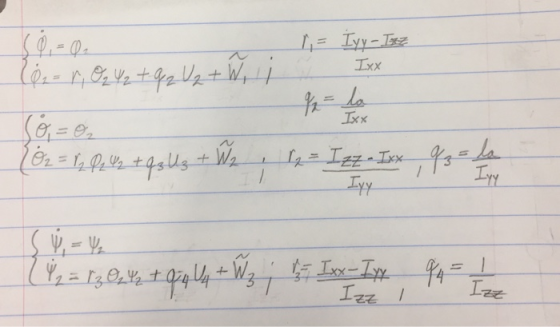
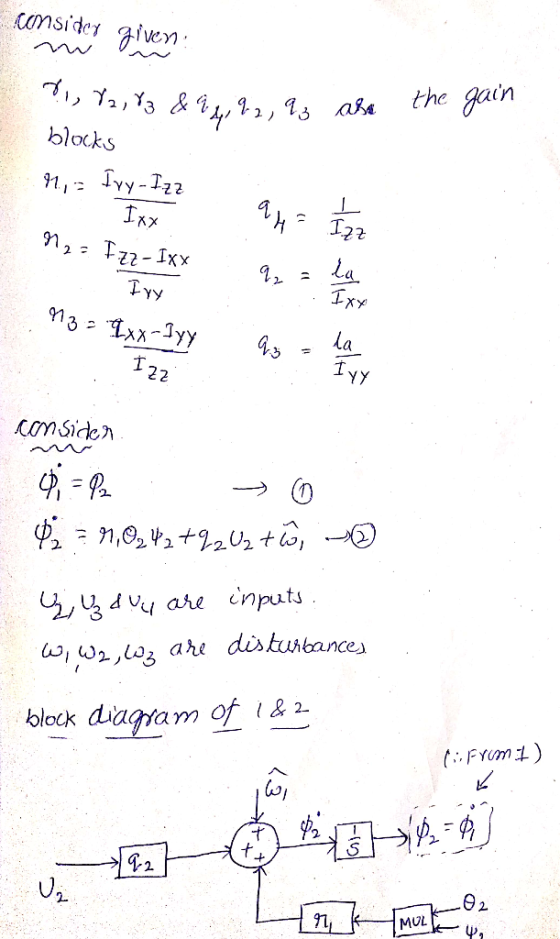
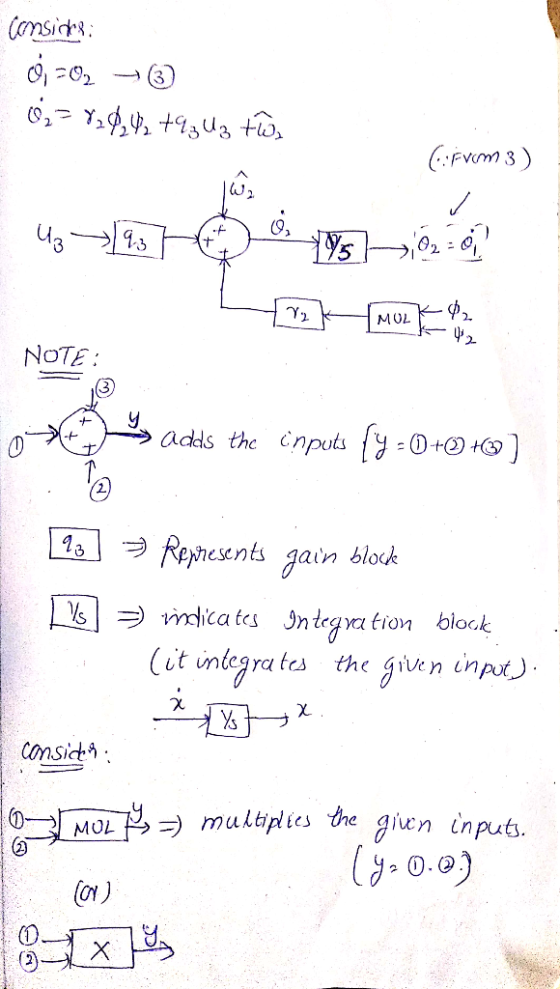
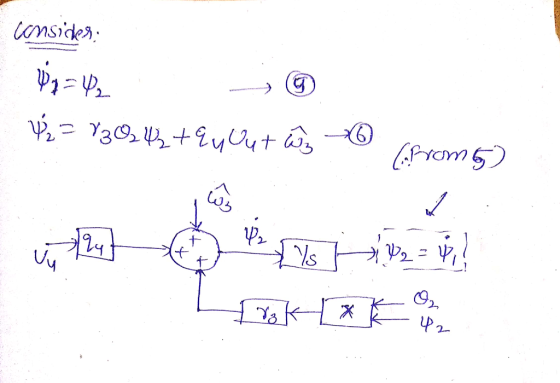
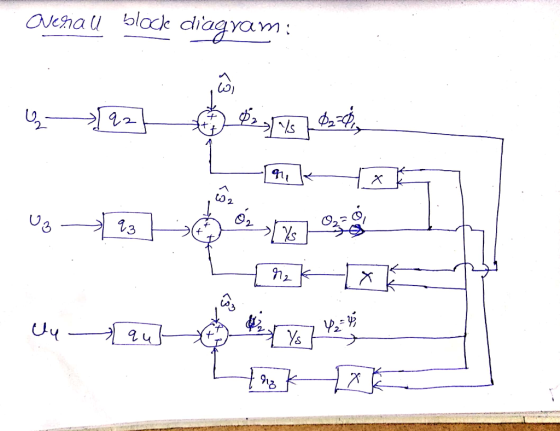
Develop a block diagram based on the following state variable description. W1-3 is the disturbanc...
3. (25 points) For the block diagram shown in Figure 1, develop the transfer function between...
 3. (25 points) For the block diagram shown in Figure 1, develop the transfer function between Y(s) and U(s) Figure 1. Block diagram for Problem 3. 4. (20 points) Consider each of the input profile in Figure 1. Develop an expression for U(s) for each case. Time Time Figure 1. Input profiles
Derive the state diagram, state table, state assignment table, and logic network using D flip-flops for...
Derive the state diagram, state table, state assignment table, and logic network using D flip-flops for the following circuit: A FSM has two input, w1 and w2, and an output z. The machine has to generate z=1 when the previous four values of w1 and w2 are the same; otherwise z=0. Overlapping patterns are allowed. An example of the desired behavior is: w1: 0 1 1 0 1 1 1 0 0 0 1 1 0 w2: 1 1 1...
Please answer all 3 questions! Thank you! 1). Calculate the control block flow diagram. Fi Ti...
 Please answer all 3 questions! Thank you!
1). Calculate the control block flow diagram. Fi Ti CT ST 2). Calculate the Laplace equivalent of the following equations: where T is the output variable, A and B are constants and u, uz, and us are the deviations variables for the input temperature (Ti), input flow (Fi) and input heat flow (Q), respectively. where T is the output variable, A, B, and C are constants and u,, U2, and uj are the...
Please answer all 3 questions! Thank you!
1). Calculate the control block flow diagram. Fi Ti CT ST 2). Calculate the Laplace equivalent of the following equations: where T is the output variable, A and B are constants and u, uz, and us are the deviations variables for the input temperature (Ti), input flow (Fi) and input heat flow (Q), respectively. where T is the output variable, A, B, and C are constants and u,, U2, and uj are the...
2. A feedback control system is subject to disturbances at the actuator input, as shown in the following block diagram. Remember that you need to use the final value theorem (and not the table) when...
 2. A feedback control system is subject to disturbances at the actuator input, as shown in the following block diagram. Remember that you need to use the final value theorem (and not the table) when dealing with any other input other than the reference. See the last 3 pages, 12-15, of my steady-state error lecture notes for examples on how to deal with disturbance rather than reference inputs D(s) 1 Y(s) $3+2s2+2s If the reference command is r(t) 1S 0,...
1- A system has a block diagram as shown. Determine a state variable representation (model) and...
 1- A system has a block diagram as shown. Determine a state variable representation (model) and state transition matrix Φ(s) R(s) + 25 Y(s) 25 2- A system has the following differential equation: 2 -3 Determine Ф(t) and its transform D(s) for the system
Question 3 a) Reduce the block diagram in Figure 3 to a single block with the...
 Question 3 a) Reduce the block diagram in Figure 3 to a single block with the overall tra (10 marks) function. H2(s) Figure 3: A block diagram comprising multiple subsystems and controllers b) For the system in Figure 4, assume that the plant has the following transfer function: If the controller in Figure 4 is proportional-only, determine the following: (2 marks) i) The system type. i) The steady-state error, es, if the reference signal, R(s) is a unit step input....
Answer the following questions based on the following scenario Consider a gene with 2 alleles, W1,...
Answer the following questions based on the following scenario Consider a gene with 2 alleles, W1, and W2. Each line is homozygous for its respective allele. When the 2 lines are crossed, all the F1 progeny has a phenotype associated with W2. 1. What is the genotype of the F1? What gametes can if produce? 2. Which allele is dominant? Why? 3. Draw the punnet square associate with a self-fertilization of the F1. 4. What proportion of the offspring will...
Problem 1: Steady-state error analvsis (a) A block diagram of a feedback control system is given ...
 The Class Name is: MAE 318 System Dynamics and Control I
Problem 1: Steady-state error analvsis (a) A block diagram of a feedback control system is given below. Assuming that the tunable constant Khas a value that makes this closed-loop system stable, find the steady-state error of the closed-loop system for (a a step reference input with amplitude R, r(t)- R u(t) (ii) a ramp reference input with slope R, r(t) = Rt-us(t) R(s) Y(s) (s+2)(s +5) (b) A block...
The Class Name is: MAE 318 System Dynamics and Control I
Problem 1: Steady-state error analvsis (a) A block diagram of a feedback control system is given below. Assuming that the tunable constant Khas a value that makes this closed-loop system stable, find the steady-state error of the closed-loop system for (a a step reference input with amplitude R, r(t)- R u(t) (ii) a ramp reference input with slope R, r(t) = Rt-us(t) R(s) Y(s) (s+2)(s +5) (b) A block...
Question: ###State Transition Diagram### This task requires you to develop a state chart diagram for an Ora... ###State Transition Diagram### This task requires you to develop a state chart diagram fo...
Question: ###State Transition Diagram### This task requires you to develop a state chart diagram for an Ora... ###State Transition Diagram### This task requires you to develop a state chart diagram for an Oral B Braun 5000 electric toothbrush. Starting from the user manual you should first analyze the functionality of the toothbrush and its interaction with the SmartGuide and then, using suitable software, produce a state transition diagram which covers both. Your state chart diagram will be demonstrated subjected to...
control system System Description: The figure 1 and 2 below show, respectively, components and block diagram...
 control system
System Description: The figure 1 and 2 below show, respectively, components and block diagram of a motor and the measurements of velocity (via the tacho unit) and position (via the potentiometer). n represents the gearbox ratio between the rotating shaft and the output shaft. The left-hand side of the diagram represents the controller. A reference set point for the rotating shaft is entered in degrees and this is equivalent voltage. The error is calculated by subtracting the measured...
control system
System Description: The figure 1 and 2 below show, respectively, components and block diagram of a motor and the measurements of velocity (via the tacho unit) and position (via the potentiometer). n represents the gearbox ratio between the rotating shaft and the output shaft. The left-hand side of the diagram represents the controller. A reference set point for the rotating shaft is entered in degrees and this is equivalent voltage. The error is calculated by subtracting the measured...
 3. (25 points) For the block diagram shown in Figure 1, develop the transfer function between Y(s) and U(s) Figure 1. Block diagram for Problem 3. 4. (20 points) Consider each of the input profile in Figure 1. Develop an expression for U(s) for each case. Time Time Figure 1. Input profiles
 Please answer all 3 questions! Thank you!
1). Calculate the control block flow diagram. Fi Ti CT ST 2). Calculate the Laplace equivalent of the following equations: where T is the output variable, A and B are constants and u, uz, and us are the deviations variables for the input temperature (Ti), input flow (Fi) and input heat flow (Q), respectively. where T is the output variable, A, B, and C are constants and u,, U2, and uj are the...
Please answer all 3 questions! Thank you!
1). Calculate the control block flow diagram. Fi Ti CT ST 2). Calculate the Laplace equivalent of the following equations: where T is the output variable, A and B are constants and u, uz, and us are the deviations variables for the input temperature (Ti), input flow (Fi) and input heat flow (Q), respectively. where T is the output variable, A, B, and C are constants and u,, U2, and uj are the...
 2. A feedback control system is subject to disturbances at the actuator input, as shown in the following block diagram. Remember that you need to use the final value theorem (and not the table) when dealing with any other input other than the reference. See the last 3 pages, 12-15, of my steady-state error lecture notes for examples on how to deal with disturbance rather than reference inputs D(s) 1 Y(s) $3+2s2+2s If the reference command is r(t) 1S 0,...
 1- A system has a block diagram as shown. Determine a state variable representation (model) and state transition matrix Φ(s) R(s) + 25 Y(s) 25 2- A system has the following differential equation: 2 -3 Determine Ф(t) and its transform D(s) for the system
 Question 3 a) Reduce the block diagram in Figure 3 to a single block with the overall tra (10 marks) function. H2(s) Figure 3: A block diagram comprising multiple subsystems and controllers b) For the system in Figure 4, assume that the plant has the following transfer function: If the controller in Figure 4 is proportional-only, determine the following: (2 marks) i) The system type. i) The steady-state error, es, if the reference signal, R(s) is a unit step input....
 The Class Name is: MAE 318 System Dynamics and Control I
Problem 1: Steady-state error analvsis (a) A block diagram of a feedback control system is given below. Assuming that the tunable constant Khas a value that makes this closed-loop system stable, find the steady-state error of the closed-loop system for (a a step reference input with amplitude R, r(t)- R u(t) (ii) a ramp reference input with slope R, r(t) = Rt-us(t) R(s) Y(s) (s+2)(s +5) (b) A block...
The Class Name is: MAE 318 System Dynamics and Control I
Problem 1: Steady-state error analvsis (a) A block diagram of a feedback control system is given below. Assuming that the tunable constant Khas a value that makes this closed-loop system stable, find the steady-state error of the closed-loop system for (a a step reference input with amplitude R, r(t)- R u(t) (ii) a ramp reference input with slope R, r(t) = Rt-us(t) R(s) Y(s) (s+2)(s +5) (b) A block...
 control system
System Description: The figure 1 and 2 below show, respectively, components and block diagram of a motor and the measurements of velocity (via the tacho unit) and position (via the potentiometer). n represents the gearbox ratio between the rotating shaft and the output shaft. The left-hand side of the diagram represents the controller. A reference set point for the rotating shaft is entered in degrees and this is equivalent voltage. The error is calculated by subtracting the measured...
control system
System Description: The figure 1 and 2 below show, respectively, components and block diagram of a motor and the measurements of velocity (via the tacho unit) and position (via the potentiometer). n represents the gearbox ratio between the rotating shaft and the output shaft. The left-hand side of the diagram represents the controller. A reference set point for the rotating shaft is entered in degrees and this is equivalent voltage. The error is calculated by subtracting the measured...
Most questions answered within 3 hours.
-
Where is the error in this code sequence?
String s1 = "Hello";
String s2 = "ello";...
asked 11 months ago -
Financial data for Joel de Paris, Inc., for last year
follow:
Joel de Paris, Inc.
Balance...
asked 11 months ago -
Consider this reaction:
Al2(SO4)3 (aq)+ BaCl3
(aq) Al2Cl6 (aq)- +
3BaSO4(s) . What is the...
asked 11 months ago -
Suppose that Savneet is considering increasing her
recent random sample from 20 car rentals to 40...
asked 11 months ago -
Trucks arrive at an unloading terminal at an average rate of 120
per hour.
Trucks arrive...
asked 11 months ago -
Why are methanol and ethanol completely soluble in water while
octanol is not very little soluble....
asked 11 months ago -
A facilities manager at a university reads in a research report
that the mean amount of...
asked 11 months ago -
When the CuSO4 is rehydrated by adding water to the anhydrous
compound, is this an endothermic...
asked 11 months ago -
A ray of sunlight is passing from diamond into crown glass; the
angle of incidence is...
asked 11 months ago -
A block of mass 0.249 kg is placed on top of a light, vertical
spring of...
asked 11 months ago -
how do the kidneys compensate in the presences of acidosis
a) trigger hyperventilate
b) reserve acid...
asked 11 months ago -
Question 501 pts
The rental rate of capital to the firm increases. Which of the
following...
asked 11 months ago