![In 17]:import numpy as np import matplotlib.pyplot as plt Implement three different methods to simulate a Poisson process (No](http://img.homeworklib.com/images/7ebb5d89-e452-471f-b510-56d5e5947609.png?x-oss-process=image/resize,w_560)
Homework Answers
SOLUTION ;-
-;GIVEN DATA;-
implement three diffrent methods to simlate a poisson process (Nt) with parameter =0.1 on the interval [0,100]
import numpy as np
import matplotlib.pyplot as plt
method 1 -
import numpy as np import matplotlib.pyplot as plt
N<-10
A<-vector(mode="integer",length = N)
A[1]=0
# parameter lambda
X<-rexp(n =N,rate = 2)
for(n in 1:N)
A[n]=sum(X[1:n])
A<-cumsum(X)
n_func <- function(t, A) sapply(t, function(t) sum(A <
t))
t_series <- seq(0, max(S), by = max(A)/N)
#Plot of the trajectory
par(mfrow=c(1,2))
plot(t_series, n_func(t_series, A),
type = "a",
ylab=expression(N[t]),
xlab="t",las=1,
cex.lab=0.8,main="Poisson Process",cex.axis=0.8)
grid()
abline(v = A,col="red",lty=2)
plot(t_series, n_func(t_series, A),
type = "a",
ylab=expression(N[t]),
xlab="t",las=1,
cex.lab=0.8,
main="Poisson Process",cex.axis=0.8)
grid()
abline(v = t_series,col="blue",lty=4)
method 2-
import numpy as np import matplotlib.pyplot as plt
# Prepare data
N = 100
lambdas = [1, 2, 5]
X_T = [np.random.poisson(lam, size=N) for lam in lambdas]
S = [[np.sum(X[0:i]) for i in xrange(N)] for X in X_T]
X = np.linspace(0, N, N)
# Plot trajectory
graphs = [plt.step(X, S[i], label="Lambda = %d"%lambdas[i])[0] for
i in xrange(len(lambdas))]
plt.legend(handles=graphs, loc=2)
plt.title("Poisson Process", fontdict={'fontname': 'Times New
Roman', 'fontsize': 21}, y=0.1)
plt.ylim(0)
plt.xlim(0)
plt.show()
Add Answer to:
In 17]:import numpy as np import matplotlib.pyplot as plt Implement three different methods to si...
Python import numpy as np import matplotlib.pyplot as plt Implement three different methods to si...
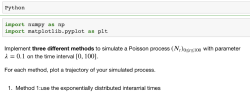 Python import numpy as np import matplotlib.pyplot as plt Implement three different methods to simulate a Poisson process (No λ 0.1 on the time interval [0, 1001 with parameter For each method, plot a trajectory of your simulated process. 1. Method 1:use the exponentially distributed interarrial times
Python import numpy as np import matplotlib.pyplot as plt Implement three different methods to simulate a Poisson process (No λ 0.1 on the time interval [0, 1001 with parameter For each method, plot...
Python import numpy as np import matplotlib.pyplot as plt Implement three different methods to simulate a Poisson process (No λ 0.1 on the time interval [0, 1001 with parameter For each method, plot a trajectory of your simulated process. 1. Method 1:use the exponentially distributed interarrial times
Python import numpy as np import matplotlib.pyplot as plt Implement three different methods to simulate a Poisson process (No λ 0.1 on the time interval [0, 1001 with parameter For each method, plot...
IN PYTHON 3 GIVING THIS CODE %matplotlib inline import numpy as np import matplotlib.pyplot as plt...
IN PYTHON 3 GIVING THIS CODE %matplotlib inline import numpy as np import matplotlib.pyplot as plt from sklearn import datasets N_samples = 2000 X = np.array(datasets.make_circles(n_samples=N_samples, noise=0.05, factor=0.3)[0]) plt.scatter(X[:,0], X[:,1], alpha=0.8, s=64, edgecolors='white'); Use Spectral Clustering to cluster the points and visualize your result
Python 1 import matplotlib.pyplot as plt 2 import numpy as np 3 4 abscissa = np.arange(20) 5 plt....
 python
1
import matplotlib.pyplot as plt
2
import numpy as np
3
4
abscissa = np.arange(20)
5
plt.gca().set_prop_cycle(
’
color
’
, [
’
red
’
,
’
green
’
,
’
blue
’
,
’
black
’
])
6
7
class MyLine:
8
9
def __init__(self,
*
args,
**
options):
10
#TO DO: IMPLEMENT FUNCTION
11
pass
12
13
def draw(self):
14
plt.plot(abscissa,self.line(abscissa))
15
16
def get_line(self):
17
return "y = {0:.2f}x + {1:.2f}".format(self.slope,
self.intercept)
18
19
def __str__(self):...
python
1
import matplotlib.pyplot as plt
2
import numpy as np
3
4
abscissa = np.arange(20)
5
plt.gca().set_prop_cycle(
’
color
’
, [
’
red
’
,
’
green
’
,
’
blue
’
,
’
black
’
])
6
7
class MyLine:
8
9
def __init__(self,
*
args,
**
options):
10
#TO DO: IMPLEMENT FUNCTION
11
pass
12
13
def draw(self):
14
plt.plot(abscissa,self.line(abscissa))
15
16
def get_line(self):
17
return "y = {0:.2f}x + {1:.2f}".format(self.slope,
self.intercept)
18
19
def __str__(self):...
PYTHON import numpy as np import pandas as pd import matplotlib.pyplot as plt from sklearn.linear_model import...
 PYTHON
import numpy as np
import pandas as pd
import matplotlib.pyplot as plt
from sklearn.linear_model import LinearRegression
from sklearn.linear_model import LogisticRegression
from sklearn.model_selection import train_test_split
Our goal is to create a linear regression model to estimate
values of ln_price using ln_carat as the only feature. We will now
prepare the feature and label arrays.
"carat" "cut" "color"
"clarity" "depth" "table"
"price" "x" "y" "z"
"1" 0.23 "Ideal" "E" "SI2" 61.5 55 326
3.95 3.98 2.43
"2" 0.21 "Premium" "E" "SI1"...
PYTHON
import numpy as np
import pandas as pd
import matplotlib.pyplot as plt
from sklearn.linear_model import LinearRegression
from sklearn.linear_model import LogisticRegression
from sklearn.model_selection import train_test_split
Our goal is to create a linear regression model to estimate
values of ln_price using ln_carat as the only feature. We will now
prepare the feature and label arrays.
"carat" "cut" "color"
"clarity" "depth" "table"
"price" "x" "y" "z"
"1" 0.23 "Ideal" "E" "SI2" 61.5 55 326
3.95 3.98 2.43
"2" 0.21 "Premium" "E" "SI1"...
do it in python 1. Import the proper libraries: Pandas and NumPy and create aliases pd,...
do it in python 1. Import the proper libraries: Pandas and NumPy and create aliases pd, np respectively. 2. Load sample data (car_loan.csv) into data frame: df 3. Export Pandas DataFrames to csv. Save file name as out.csv. hint: help(df.to_csv) 4. Run the command: df.info (). What do you see, how many columns? also what about number of entries for each column 5. It is often the case where you change your column names or remove unnecessary columns. a. Change...
This is a python matplotlib question. So it would be great if you could show me...
 This is a python matplotlib question. So it would be
great if you could show me in python method.
I have this loadtxt that asked to plot histogram of
wind gusts(column 3) that lie in direction angle(column 2) from min
angle to max angle inclusively. I don't know how to include
min_angle and max_angle into my codes.
Histogram of wind gust speeds As before the file akaroawindgusts.txt contains hourly maximum wind gusts speeds at the Akaroa Electronic weather station (EW)...
This is a python matplotlib question. So it would be
great if you could show me in python method.
I have this loadtxt that asked to plot histogram of
wind gusts(column 3) that lie in direction angle(column 2) from min
angle to max angle inclusively. I don't know how to include
min_angle and max_angle into my codes.
Histogram of wind gust speeds As before the file akaroawindgusts.txt contains hourly maximum wind gusts speeds at the Akaroa Electronic weather station (EW)...
Problem 1: Random Walk A random walk is a stochastic process. A stochastic process is a series of...
 python / visual studio
Problem 1: Random Walk A random walk is a stochastic process. A stochastic process is a series of values that are not determined functionally, but probabilistically. The random walk is supposed to describe an inebriated person who, starting from the bar, intends to walk home, but because of intoxication instead randomly takes single steps either forward or backward, left or right. The person has no memory of any steps taken, so theoretically, the person shouldn't move...
python / visual studio
Problem 1: Random Walk A random walk is a stochastic process. A stochastic process is a series of values that are not determined functionally, but probabilistically. The random walk is supposed to describe an inebriated person who, starting from the bar, intends to walk home, but because of intoxication instead randomly takes single steps either forward or backward, left or right. The person has no memory of any steps taken, so theoretically, the person shouldn't move...
python / visual studio Problem 1: Random Walk A random walk is a stochastic process. A...
 python / visual studio
Problem 1: Random Walk A random walk is a stochastic process. A stochastic process is a series of values that are not determined functionally, but probabilistically. The random walk is supposed to describe an inebriated person who, starting from the bar, intends to walk home, but because of intoxication instead randomly takes single steps either forward or backward, left or right. The person has no memory of any steps taken, so theoretically, the person shouldn't move...
python / visual studio
Problem 1: Random Walk A random walk is a stochastic process. A stochastic process is a series of values that are not determined functionally, but probabilistically. The random walk is supposed to describe an inebriated person who, starting from the bar, intends to walk home, but because of intoxication instead randomly takes single steps either forward or backward, left or right. The person has no memory of any steps taken, so theoretically, the person shouldn't move...
Samples of three different species of amphibian (frog, toad and salamander) were collected and dissected and...
 Samples of three different species of amphibian (frog, toad and salamander) were collected and dissected and the number of parasites found within each was counted and recorded. The researchers are interested in determining whether the distribution of parasites across species is different. The number of parasites within each sample was counted and recorded. Toads Frogs Salamanders 1 6 a 3 11 5 111 8 17 Z 17 3 11 5 17 16 8 14 4 17 10 The researchers made...
Description In this homework, you are asked to implement a multithreaded program that will allow ...
 Description In this homework, you are asked to implement a multithreaded program that will allow us to measure the performance (i.e, CPU utilization, Throughput, Turnaround time, and Waiting time in Ready Queue) of the four basic CPU scheduling algorithms (namely, FIFO, SJE PR, and RR). Your program will be emulating/simulating the processes whose priority, sequence of CPU burst time(ms) and I'O burst time(ms) will be given in an input file. Assume that all scheduling algorithms except RR will be non-preemptive,...
 Python import numpy as np import matplotlib.pyplot as plt Implement three different methods to simulate a Poisson process (No λ 0.1 on the time interval [0, 1001 with parameter For each method, plot a trajectory of your simulated process. 1. Method 1:use the exponentially distributed interarrial times
Python import numpy as np import matplotlib.pyplot as plt Implement three different methods to simulate a Poisson process (No λ 0.1 on the time interval [0, 1001 with parameter For each method, plot...
Python import numpy as np import matplotlib.pyplot as plt Implement three different methods to simulate a Poisson process (No λ 0.1 on the time interval [0, 1001 with parameter For each method, plot a trajectory of your simulated process. 1. Method 1:use the exponentially distributed interarrial times
Python import numpy as np import matplotlib.pyplot as plt Implement three different methods to simulate a Poisson process (No λ 0.1 on the time interval [0, 1001 with parameter For each method, plot...
 python
1
import matplotlib.pyplot as plt
2
import numpy as np
3
4
abscissa = np.arange(20)
5
plt.gca().set_prop_cycle(
’
color
’
, [
’
red
’
,
’
green
’
,
’
blue
’
,
’
black
’
])
6
7
class MyLine:
8
9
def __init__(self,
*
args,
**
options):
10
#TO DO: IMPLEMENT FUNCTION
11
pass
12
13
def draw(self):
14
plt.plot(abscissa,self.line(abscissa))
15
16
def get_line(self):
17
return "y = {0:.2f}x + {1:.2f}".format(self.slope,
self.intercept)
18
19
def __str__(self):...
python
1
import matplotlib.pyplot as plt
2
import numpy as np
3
4
abscissa = np.arange(20)
5
plt.gca().set_prop_cycle(
’
color
’
, [
’
red
’
,
’
green
’
,
’
blue
’
,
’
black
’
])
6
7
class MyLine:
8
9
def __init__(self,
*
args,
**
options):
10
#TO DO: IMPLEMENT FUNCTION
11
pass
12
13
def draw(self):
14
plt.plot(abscissa,self.line(abscissa))
15
16
def get_line(self):
17
return "y = {0:.2f}x + {1:.2f}".format(self.slope,
self.intercept)
18
19
def __str__(self):...
 PYTHON
import numpy as np
import pandas as pd
import matplotlib.pyplot as plt
from sklearn.linear_model import LinearRegression
from sklearn.linear_model import LogisticRegression
from sklearn.model_selection import train_test_split
Our goal is to create a linear regression model to estimate
values of ln_price using ln_carat as the only feature. We will now
prepare the feature and label arrays.
"carat" "cut" "color"
"clarity" "depth" "table"
"price" "x" "y" "z"
"1" 0.23 "Ideal" "E" "SI2" 61.5 55 326
3.95 3.98 2.43
"2" 0.21 "Premium" "E" "SI1"...
PYTHON
import numpy as np
import pandas as pd
import matplotlib.pyplot as plt
from sklearn.linear_model import LinearRegression
from sklearn.linear_model import LogisticRegression
from sklearn.model_selection import train_test_split
Our goal is to create a linear regression model to estimate
values of ln_price using ln_carat as the only feature. We will now
prepare the feature and label arrays.
"carat" "cut" "color"
"clarity" "depth" "table"
"price" "x" "y" "z"
"1" 0.23 "Ideal" "E" "SI2" 61.5 55 326
3.95 3.98 2.43
"2" 0.21 "Premium" "E" "SI1"...
 This is a python matplotlib question. So it would be
great if you could show me in python method.
I have this loadtxt that asked to plot histogram of
wind gusts(column 3) that lie in direction angle(column 2) from min
angle to max angle inclusively. I don't know how to include
min_angle and max_angle into my codes.
Histogram of wind gust speeds As before the file akaroawindgusts.txt contains hourly maximum wind gusts speeds at the Akaroa Electronic weather station (EW)...
This is a python matplotlib question. So it would be
great if you could show me in python method.
I have this loadtxt that asked to plot histogram of
wind gusts(column 3) that lie in direction angle(column 2) from min
angle to max angle inclusively. I don't know how to include
min_angle and max_angle into my codes.
Histogram of wind gust speeds As before the file akaroawindgusts.txt contains hourly maximum wind gusts speeds at the Akaroa Electronic weather station (EW)...
 python / visual studio
Problem 1: Random Walk A random walk is a stochastic process. A stochastic process is a series of values that are not determined functionally, but probabilistically. The random walk is supposed to describe an inebriated person who, starting from the bar, intends to walk home, but because of intoxication instead randomly takes single steps either forward or backward, left or right. The person has no memory of any steps taken, so theoretically, the person shouldn't move...
python / visual studio
Problem 1: Random Walk A random walk is a stochastic process. A stochastic process is a series of values that are not determined functionally, but probabilistically. The random walk is supposed to describe an inebriated person who, starting from the bar, intends to walk home, but because of intoxication instead randomly takes single steps either forward or backward, left or right. The person has no memory of any steps taken, so theoretically, the person shouldn't move...
 python / visual studio
Problem 1: Random Walk A random walk is a stochastic process. A stochastic process is a series of values that are not determined functionally, but probabilistically. The random walk is supposed to describe an inebriated person who, starting from the bar, intends to walk home, but because of intoxication instead randomly takes single steps either forward or backward, left or right. The person has no memory of any steps taken, so theoretically, the person shouldn't move...
python / visual studio
Problem 1: Random Walk A random walk is a stochastic process. A stochastic process is a series of values that are not determined functionally, but probabilistically. The random walk is supposed to describe an inebriated person who, starting from the bar, intends to walk home, but because of intoxication instead randomly takes single steps either forward or backward, left or right. The person has no memory of any steps taken, so theoretically, the person shouldn't move...
 Samples of three different species of amphibian (frog, toad and salamander) were collected and dissected and the number of parasites found within each was counted and recorded. The researchers are interested in determining whether the distribution of parasites across species is different. The number of parasites within each sample was counted and recorded. Toads Frogs Salamanders 1 6 a 3 11 5 111 8 17 Z 17 3 11 5 17 16 8 14 4 17 10 The researchers made...
 Description In this homework, you are asked to implement a multithreaded program that will allow us to measure the performance (i.e, CPU utilization, Throughput, Turnaround time, and Waiting time in Ready Queue) of the four basic CPU scheduling algorithms (namely, FIFO, SJE PR, and RR). Your program will be emulating/simulating the processes whose priority, sequence of CPU burst time(ms) and I'O burst time(ms) will be given in an input file. Assume that all scheduling algorithms except RR will be non-preemptive,...
Most questions answered within 3 hours.
-
Where is the error in this code sequence?
String s1 = "Hello";
String s2 = "ello";...
asked 11 months ago -
Financial data for Joel de Paris, Inc., for last year
follow:
Joel de Paris, Inc.
Balance...
asked 11 months ago -
Consider this reaction:
Al2(SO4)3 (aq)+ BaCl3
(aq) Al2Cl6 (aq)- +
3BaSO4(s) . What is the...
asked 11 months ago -
Suppose that Savneet is considering increasing her
recent random sample from 20 car rentals to 40...
asked 11 months ago -
Trucks arrive at an unloading terminal at an average rate of 120
per hour.
Trucks arrive...
asked 11 months ago -
Why are methanol and ethanol completely soluble in water while
octanol is not very little soluble....
asked 11 months ago -
A facilities manager at a university reads in a research report
that the mean amount of...
asked 11 months ago -
When the CuSO4 is rehydrated by adding water to the anhydrous
compound, is this an endothermic...
asked 11 months ago -
A ray of sunlight is passing from diamond into crown glass; the
angle of incidence is...
asked 11 months ago -
A block of mass 0.249 kg is placed on top of a light, vertical
spring of...
asked 11 months ago -
how do the kidneys compensate in the presences of acidosis
a) trigger hyperventilate
b) reserve acid...
asked 11 months ago -
Question 501 pts
The rental rate of capital to the firm increases. Which of the
following...
asked 11 months ago