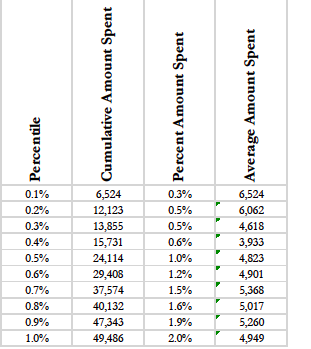
The following picture is taken from a “Gains Chart” derived from a holdout sample in a Discriminant Analysis Regression Model. Which of the following statements is not a correct conclusion from the picture?
a. 2% of all dollars spent can be found among the predicted “top 1% of customers”
b. 2% of all dollars spent can be found among the actual “top 1% of customers”
c. The “Average Amount Spent” for the “Percentile” – 0.4% is $3,933, which is an error
d. From this picture you cannot calculate the total amount spent
Homework Answers
B & C are not correct
b. 2% of all dollars spent can be found among the actual “top 1% of customers”
c. The “Average Amount Spent” for the “Percentile” – 0.4% is $3,933, which is an error
Add Answer to:
The following picture is taken from a “Gains Chart” derived from a holdout sample in a Discriminant Analysis Regression Model. Which of the following statements is not a correct conclusion from the p...
How can we assess whether a project is a success or a failure? This case presents...
 How can we assess whether a project is a success or a
failure?
This case presents two phases of a large business transformation project involving the implementation of an ERP system with the aim of creating an integrated company. The case illustrates some of the challenges associated with integration. It also presents the obstacles facing companies that undertake projects involving large information technology projects. Bombardier and Its Environment Joseph-Armand Bombardier was 15 years old when he built his first snowmobile...
How can we assess whether a project is a success or a
failure?
This case presents two phases of a large business transformation project involving the implementation of an ERP system with the aim of creating an integrated company. The case illustrates some of the challenges associated with integration. It also presents the obstacles facing companies that undertake projects involving large information technology projects. Bombardier and Its Environment Joseph-Armand Bombardier was 15 years old when he built his first snowmobile...
Most questions answered within 3 hours.
-
Where is the error in this code sequence?
String s1 = "Hello";
String s2 = "ello";...
asked 11 months ago -
Financial data for Joel de Paris, Inc., for last year
follow:
Joel de Paris, Inc.
Balance...
asked 11 months ago -
Consider this reaction:
Al2(SO4)3 (aq)+ BaCl3
(aq) Al2Cl6 (aq)- +
3BaSO4(s) . What is the...
asked 11 months ago -
Suppose that Savneet is considering increasing her
recent random sample from 20 car rentals to 40...
asked 11 months ago -
Trucks arrive at an unloading terminal at an average rate of 120
per hour.
Trucks arrive...
asked 11 months ago -
Why are methanol and ethanol completely soluble in water while
octanol is not very little soluble....
asked 11 months ago -
A facilities manager at a university reads in a research report
that the mean amount of...
asked 11 months ago -
When the CuSO4 is rehydrated by adding water to the anhydrous
compound, is this an endothermic...
asked 11 months ago -
A ray of sunlight is passing from diamond into crown glass; the
angle of incidence is...
asked 11 months ago -
A block of mass 0.249 kg is placed on top of a light, vertical
spring of...
asked 11 months ago -
how do the kidneys compensate in the presences of acidosis
a) trigger hyperventilate
b) reserve acid...
asked 11 months ago -
Question 501 pts
The rental rate of capital to the firm increases. Which of the
following...
asked 11 months ago