Key Objective: Crusty Pizza Executives must forecast December sales for the 10 stores in worksheet “Time Series”. Use d...
Key Objective: Crusty Pizza Executives must forecast December sales for the 10 stores in worksheet “Time Series”.
- Use data in worksheet “Time Series”. Plot the data for each store.
- Develop a sales forecast for each of the 10 stores for the month of December, using:
- A three month moving average
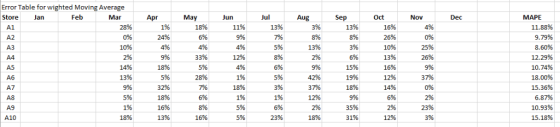
- A 2- month weighted moving average, with weights of 0.7 on the most recent month and 0.3 on the older month.
- Exponential smoothing with an alpha value of 0.25. Assume February forecast is January’s actual.
- Compute measures of forecast accuracy to recommend the best forecasting technique to use for the data.
- Rank the 10 stores based on the forecasts you made with the technique that you determined (in the above step) to be the best forecasting method.
| Monthly Profit Data for ten stores | ||||||||||||
| Store | Jan | Feb | Mar | Apr | May | Jun | Jul | Aug | Sep | Oct | Nov | Dec |
| A1 | $26,811.50 | $27,322.19 | $21,193.85 | $22,725.94 | $27,066.85 | $28,854.28 | $25,024.06 | $27,066.85 | $23,491.98 | $29,109.63 | $26,300.80 | ? |
| A2 | $973.59 | $1,021.09 | $1,009.21 | $1,329.79 | $1,163.56 | $1,116.07 | $1,211.06 | $1,282.29 | $1,377.28 | $1,068.58 | $1,163.56 | ? |
| A3 | $10,424.42 | $8,687.02 | $8,380.42 | $8,176.02 | $8,584.82 | $8,789.22 | $8,278.22 | $9,709.02 | $8,993.62 | $8,380.42 | $11,344.22 | ? |
| A4 | $28,513.55 | $27,513.08 | $28,263.44 | $25,762.25 | $20,009.51 | $24,761.77 | $21,510.23 | $22,010.46 | $23,261.06 | $20,259.63 | $28,513.55 | ? |
| A5 | $27,107.93 | $21,234.54 | $26,656.13 | $21,234.54 | $24,171.24 | $22,364.04 | $21,686.34 | $24,171.24 | $20,330.95 | $18,523.75 | $21,008.64 | ? |
| A6 | $16,897.72 | $19,009.93 | $16,321.66 | $16,321.66 | $22,658.30 | $20,546.09 | $22,274.26 | $15,361.56 | $21,506.18 | $22,466.28 | $16,129.64 | ? |
| A7 | $15,456.55 | $20,964.06 | $21,141.72 | $15,989.54 | $16,344.86 | $19,720.43 | $19,365.10 | $14,212.92 | $19,187.44 | $20,608.73 | $20,253.41 | ? |
| A8 | $11,021.75 | $8,502.49 | $9,762.12 | $11,441.62 | $10,286.96 | $10,496.90 | $10,286.96 | $11,756.53 | $12,491.31 | $11,546.59 | $12,071.44 | ? |
| A9 | $10,338.61 | $10,232.03 | $10,338.61 | $12,257.11 | $12,683.45 | $11,937.36 | $11,511.03 | $11,937.36 | $8,739.86 | $9,485.94 | $12,043.95 | ? |
| A10 | $6,643.92 | $5,979.53 | $7,507.63 | $6,245.28 | $7,839.83 | $7,042.56 | $5,913.09 | $5,315.14 | $7,906.26 | $6,378.16 | $7,042.56 | ? |
Homework Answers


Add Answer to:
Key Objective: Crusty Pizza Executives must forecast December sales for the 10 stores in worksheet “Time Series”. Use d...
Key Objective: Crusty Pizza Executives must forecast December sales for the 10 stores in worksheet “Time...
Key Objective: Crusty Pizza Executives must forecast December sales for the 10 stores in worksheet “Time Series”. Use data in worksheet “Time Series”. Plot the data for each store. Develop a sales forecast for each of the 10 stores for the month of December, using: A three month moving average A 2- month weighted moving average, with weights of 0.7 on the most recent month and 0.3 on the older month. Exponential smoothing with an alpha value of 0.25. Assume...
Use data in worksheet “Time Series”. Plot the data for each store. Develop a sales forecast...
Use data in worksheet “Time Series”. Plot the data for each store. Develop a sales forecast for each of the 10 stores for the month of December, using: A three month moving average A 2- month weighted moving average, with weights of 0.7 on the most recent month and 0.3 on the older month. Exponential smoothing with an alpha value of 0.25. Assume February forecast is January’s actual. Compute measures of forecast accuracy to recommend the best forecasting technique to...
Masters Level work....all work must be shown. FORECASTING Forecasting ASSIgnment 1. Given the following data, use...
 Masters Level work....all work must be shown. FORECASTING
Forecasting ASSIgnment 1. Given the following data, use a three-quarter moving average to forecast the demand for the third quarter of this year. Note, the first quarter is January, February, and March; the second quarter is April, May, and June; the third quarter is July, August, September, and the 4° quarter is October, November, and December ul ct 50 This year 235 245 255 295 305 295 Answer (Please show your work...
Masters Level work....all work must be shown. FORECASTING
Forecasting ASSIgnment 1. Given the following data, use a three-quarter moving average to forecast the demand for the third quarter of this year. Note, the first quarter is January, February, and March; the second quarter is April, May, and June; the third quarter is July, August, September, and the 4° quarter is October, November, and December ul ct 50 This year 235 245 255 295 305 295 Answer (Please show your work...
Accountancy
First Thing: Save This File as Your Whole NameAfter nearly destroying the city of Springfield USA because of many near nuclear melt downs caused by Homer Simpson, Mr. Burns decided to go into selling cookies. On January 2, 2020, Mr. Burn continued his Good Old Fashion Cookies Empire. The company is still a merchandise company and still uses a perpetual inventory system.1. Prepare all the journal entries on a document. (To be turned in separately)2. Post all journal entries to...
 Masters Level work....all work must be shown. FORECASTING
Forecasting ASSIgnment 1. Given the following data, use a three-quarter moving average to forecast the demand for the third quarter of this year. Note, the first quarter is January, February, and March; the second quarter is April, May, and June; the third quarter is July, August, September, and the 4° quarter is October, November, and December ul ct 50 This year 235 245 255 295 305 295 Answer (Please show your work...
Masters Level work....all work must be shown. FORECASTING
Forecasting ASSIgnment 1. Given the following data, use a three-quarter moving average to forecast the demand for the third quarter of this year. Note, the first quarter is January, February, and March; the second quarter is April, May, and June; the third quarter is July, August, September, and the 4° quarter is October, November, and December ul ct 50 This year 235 245 255 295 305 295 Answer (Please show your work...
Most questions answered within 3 hours.
-
Where is the error in this code sequence?
String s1 = "Hello";
String s2 = "ello";...
asked 10 months ago -
Financial data for Joel de Paris, Inc., for last year
follow:
Joel de Paris, Inc.
Balance...
asked 10 months ago -
Consider this reaction:
Al2(SO4)3 (aq)+ BaCl3
(aq) Al2Cl6 (aq)- +
3BaSO4(s) . What is the...
asked 10 months ago -
Suppose that Savneet is considering increasing her
recent random sample from 20 car rentals to 40...
asked 10 months ago -
Trucks arrive at an unloading terminal at an average rate of 120
per hour.
Trucks arrive...
asked 10 months ago -
Why are methanol and ethanol completely soluble in water while
octanol is not very little soluble....
asked 10 months ago -
A facilities manager at a university reads in a research report
that the mean amount of...
asked 10 months ago -
When the CuSO4 is rehydrated by adding water to the anhydrous
compound, is this an endothermic...
asked 10 months ago -
A ray of sunlight is passing from diamond into crown glass; the
angle of incidence is...
asked 10 months ago -
A block of mass 0.249 kg is placed on top of a light, vertical
spring of...
asked 10 months ago -
how do the kidneys compensate in the presences of acidosis
a) trigger hyperventilate
b) reserve acid...
asked 10 months ago -
Question 501 pts
The rental rate of capital to the firm increases. Which of the
following...
asked 10 months ago