
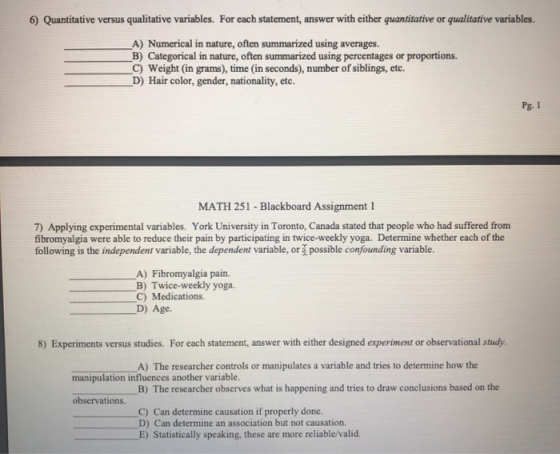


6) Quantitative versus qualitative variables. For each statement, answer with either quantitative or qualitative variables. A) Numerical in nature, often summarized using averages. B) Categorical in nature, often summarized using percentages or proportions. C) Weight (in grams), time (in seconds), number of siblings, etc. D) Hair color, gender, nationality, etc. Pg. 1 MATH 251 Blackboard Assignment 1 7) Applying experimental variables. York University in Toronto, Canada stated that people who had suffered from fibromyalgia were able to reduce their pain by participating in twice-weekly yoga. Determine whether each of the following is the independent variable, the dependent variable, or possible confounding variable. A) Fibromyalgia pain. B) Twice-weekly yoga. C) Medications. D) Age. 8) Experiments versus studies. For each statement, answer with either designed experiment or observational study. A) The researcher controls or manipulates a variable and tries to determine how the manipulation influences another variable. B) The researcher observes what is happening and tries to draw conclusions based on the observations C) Can determine causation if properly done. D) Can determine an association but not causation. E) Statistically speaking, these are more reliable/valid.
9) Defining sampling methods. For each statement, answer with either simple-random, systematic, cluster, stratified, or convenience A) You group the population and collect a simple-random sample from every group B) The ideal sample (i.e. most reliable). Every member has an equal chance of being sampled C) The least reliable sample, it is not random and has the highest potential of bias. D) You group the population and sample every member of randomly chosen groups. E) You randomly choose a starting member and then sample every k member. 10) Identifying the sampling method. For each statement, answer with either simple-random, systematic, cluster, stratified, or convenience. A) A group of students ask every 10th person from the school's student registry about how they feel about the parking on campus starting with the 4th person who they chose randomly. B) Levodopa is a drug used to help control the symptoms of Parkinson's disease. Doctors wish to choose 80 out of 200 patients with Parkinson's disease to test the effectiveness of Levodopa. They assign each patient a number from 1 to 200. They then choose 80 nubers using a random number table. C) A chemist divides a group of flasks of acids and bases into 7 categories based on pH. She then takes a simple random sample from each of the 7 categories in order to use in an experiment. D) A florist sells roses by the dozen and currently has 120 roses separated in 10 different bunches. She randomly picks 2 bunches and use the 24 roses to determine the average number of petals per rose. E) A student wants to estimate the percentage of her friends that vape. She posts a poll on Twitter and asks her friends to respond.
11) Histograms are very important to identify the 'shape' of a quantitative dataset. A) Which histogram would be described as fairly bell-shaped? B) Which histogram would be described as fairly uniform? C) Which histogram would be described as skewed to the right or skewed positively? 12) Some graphs are appropriate for qualitative data while others are appropriate for quantitative data. For each of the A) Pie chart B) Histogram C) Stem-and-leaf plot D) Frequency polygorn E) Pareto F) Cumulative frequency distribution 13) Explain why the following bar graph is misleading and how you would fix it. Effectivepess of Allergy Medicines 30.7 0.5 за 4 0.3 Pellaway Happajoy
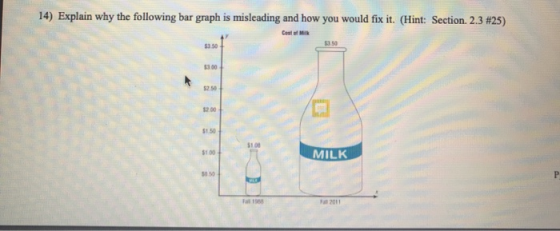
14) Explain why the following bar graph is misleading and how you would fix it. (Hint: Section. 2.3 #25) $3.00 52.50 $2 00 $1 50 51 00 MILK $1 00 0 10 a 1958 Fal 2011
Homework Answers
I can only answer 1 question at a time so I am solving question 2).
2)
A) population
B) sample
C) sample
D) population
E) sample
Please do rate me and mention doubts in the comments section.
Add Answer to:
2) Populations versus samples. For each statement, answer with either population, sample, or both. A) The compl...
9.6 in order to compare the means of two populations, inde- NW pendent random samples of 400 observations are selected from each population, with the following results Sample 1 Sample 2 $.240 s2 200...
 9.6 in order to compare the means of two populations, inde- NW pendent random samples of 400 observations are selected from each population, with the following results Sample 1 Sample 2 $.240 s2 200 5,275 1150 a. Use a 95% confidence interval to estimate the dif- ference between the population means (μ,-μ Interpret the confidence interval. b. Test the null hypothesis Ho (μι-μ)--0 versus the c. Suppose the test in part b were conducted with the d. Test thenull hypothesis...
Explain how populations and samples differ Choose the correct answer below ( A. A sample is...
 Explain how populations and samples differ Choose the correct answer below ( A. A sample is a set of measurements that are recorded on a naturally occurring numerical scale. A population is a set of measurements that cannot be measured on 0 B. O C. ( D. a natural numerical scale; they can only be classified into one of a group of categories A population is a set of units of interest to a study. A sample is a subset...
1) Two separate samples are selected from the same population. Each have an n=8. Both samples...
1) Two separate samples are selected from the same population. Each have an n=8. Both samples receive a different treatment. After the treatment, the first sample has SS=16 and the second sample has SS=24. a. Using symbols, state the hypotheses for a two-tailed test. b. With a two-tail α=0.05, identify the degrees of freedom and the critical regions. c. Calculate the pooled variance. d. Calculate the estimated standard error. e. With a mean of 3 for the first group and...
In order to compare the means of two populations, independent random samples of 385 observations are...
In order to compare the means of two populations, independent random samples of 385 observations are selected from each population, with the results found in the table to the right. Complete parts a through e. Sample 1 Sample 2 X1 = 5,337 X2 = 5,298 s1 = 157 s2 = 191 a. use a 95% confidence interval to estimate the difference between the population means (u1 - u2). Interpret the confidence interval. b. test the null hypothesis H0: (u1 - u2)...
in order to compare the means of two populations, independent random samples of 400 observations are...
in order to compare the means of two populations, independent random samples of 400 observations are selected from each population with the results: sample 1: x1= 5275 and s1= 150 sample 2: x2= 5240 and s2 = 200 a. use a 95% confidence interval to estimate the difference between the population means (m1-m2) interpret the difference. b. test the null hypothesis (m1-m2 = 0) versus the alternative (m1-m2 isn't = to 0). give the p-value of the test and interpret...
Need help with question 65! information to answer the next two exercis0s e duration (amount of...
 Need help with question 65!
information to answer the next two exercis0s e duration (amount of time) of resident A study was done to determine the age, number of times pe use of a local park in San Jose. The first house in the neighborhood around the park then every 8th house in the neighborhood around the park was interviewed 63. "Number of times per weok" is what type of data? a qualitative Quantitative discrote c. quantitative continuous 64. "Duration...
Need help with question 65!
information to answer the next two exercis0s e duration (amount of time) of resident A study was done to determine the age, number of times pe use of a local park in San Jose. The first house in the neighborhood around the park then every 8th house in the neighborhood around the park was interviewed 63. "Number of times per weok" is what type of data? a qualitative Quantitative discrote c. quantitative continuous 64. "Duration...
uctions: Show all your work for each of the problems to obtain partial credits I. Identification...
 uctions: Show all your work for each of the problems to obtain partial credits I. Identification Questions (1) Identify the type of data (Qualitative or Quantitative), if quantitative, continus or the level (nominal, ordinal, interval, ratio) of measurement most suitable in el Description Qualitative Quantitative Discrete/Continnous Measurment (a) The type of cars in the parking lot (b) The height of students in our c The ages in years of current LIU professors (d) The final scores of every game the...
In order to compare the means of two populations, independent random samples of 395 observations are...
 In order to compare the means of two populations, independent random samples of 395 observations are selected from each population, with the results found in the table to the right. Complete parts a through e below. Sample 2 x2 = 5,250 2-210 Sample 1 X,5,279 1-140 a. Use a 95% confidence interval to estimate the difference between the population means (μ1-μ2) . Interpret the confidence The confidence interval is Round to one decimal place as needed.) Interpret the confidence interval....
Please include all calculation and answer in complete sentences. thank you Phone in the John In...
 Please include all calculation and answer in complete sentences.
thank you
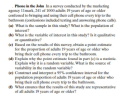
Phone in the John In a survey conducted by the marketing agency 11mark, 241 of 1000 adults 19 years of age or older confessed to bringing and using their cell phone every trip to the bathroom (confessions included texting and answering phone calls). (a) What is the sample in this study? What is the population of interest? (b) What is the variable of interest in this study? Is it...
Please include all calculation and answer in complete sentences.
thank you
Phone in the John In a survey conducted by the marketing agency 11mark, 241 of 1000 adults 19 years of age or older confessed to bringing and using their cell phone every trip to the bathroom (confessions included texting and answering phone calls). (a) What is the sample in this study? What is the population of interest? (b) What is the variable of interest in this study? Is it...
Multiple Choices 4. the best way to form a cluster of 20 samples from a population...
Multiple Choices 4. the best way to form a cluster of 20 samples from a population measuring 320: a. all members of the population are written in pieces of paper and then put in a box. Twenty pieces of paper were selected from the box b. all population members are written in the alphabetical list. the first sixteen parts of the list are taken randomly and become members of the population. Then each 16th name in the list of members...
 9.6 in order to compare the means of two populations, inde- NW pendent random samples of 400 observations are selected from each population, with the following results Sample 1 Sample 2 $.240 s2 200 5,275 1150 a. Use a 95% confidence interval to estimate the dif- ference between the population means (μ,-μ Interpret the confidence interval. b. Test the null hypothesis Ho (μι-μ)--0 versus the c. Suppose the test in part b were conducted with the d. Test thenull hypothesis...
 Explain how populations and samples differ Choose the correct answer below ( A. A sample is a set of measurements that are recorded on a naturally occurring numerical scale. A population is a set of measurements that cannot be measured on 0 B. O C. ( D. a natural numerical scale; they can only be classified into one of a group of categories A population is a set of units of interest to a study. A sample is a subset...
 Need help with question 65!
information to answer the next two exercis0s e duration (amount of time) of resident A study was done to determine the age, number of times pe use of a local park in San Jose. The first house in the neighborhood around the park then every 8th house in the neighborhood around the park was interviewed 63. "Number of times per weok" is what type of data? a qualitative Quantitative discrote c. quantitative continuous 64. "Duration...
Need help with question 65!
information to answer the next two exercis0s e duration (amount of time) of resident A study was done to determine the age, number of times pe use of a local park in San Jose. The first house in the neighborhood around the park then every 8th house in the neighborhood around the park was interviewed 63. "Number of times per weok" is what type of data? a qualitative Quantitative discrote c. quantitative continuous 64. "Duration...
 uctions: Show all your work for each of the problems to obtain partial credits I. Identification Questions (1) Identify the type of data (Qualitative or Quantitative), if quantitative, continus or the level (nominal, ordinal, interval, ratio) of measurement most suitable in el Description Qualitative Quantitative Discrete/Continnous Measurment (a) The type of cars in the parking lot (b) The height of students in our c The ages in years of current LIU professors (d) The final scores of every game the...
 In order to compare the means of two populations, independent random samples of 395 observations are selected from each population, with the results found in the table to the right. Complete parts a through e below. Sample 2 x2 = 5,250 2-210 Sample 1 X,5,279 1-140 a. Use a 95% confidence interval to estimate the difference between the population means (μ1-μ2) . Interpret the confidence The confidence interval is Round to one decimal place as needed.) Interpret the confidence interval....
 Please include all calculation and answer in complete sentences.
thank you
Phone in the John In a survey conducted by the marketing agency 11mark, 241 of 1000 adults 19 years of age or older confessed to bringing and using their cell phone every trip to the bathroom (confessions included texting and answering phone calls). (a) What is the sample in this study? What is the population of interest? (b) What is the variable of interest in this study? Is it...
Please include all calculation and answer in complete sentences.
thank you
Phone in the John In a survey conducted by the marketing agency 11mark, 241 of 1000 adults 19 years of age or older confessed to bringing and using their cell phone every trip to the bathroom (confessions included texting and answering phone calls). (a) What is the sample in this study? What is the population of interest? (b) What is the variable of interest in this study? Is it...
Most questions answered within 3 hours.
-
Where is the error in this code sequence?
String s1 = "Hello";
String s2 = "ello";...
asked 11 months ago -
Financial data for Joel de Paris, Inc., for last year
follow:
Joel de Paris, Inc.
Balance...
asked 11 months ago -
Consider this reaction:
Al2(SO4)3 (aq)+ BaCl3
(aq) Al2Cl6 (aq)- +
3BaSO4(s) . What is the...
asked 11 months ago -
Suppose that Savneet is considering increasing her
recent random sample from 20 car rentals to 40...
asked 11 months ago -
Trucks arrive at an unloading terminal at an average rate of 120
per hour.
Trucks arrive...
asked 11 months ago -
Why are methanol and ethanol completely soluble in water while
octanol is not very little soluble....
asked 11 months ago -
A facilities manager at a university reads in a research report
that the mean amount of...
asked 11 months ago -
When the CuSO4 is rehydrated by adding water to the anhydrous
compound, is this an endothermic...
asked 11 months ago -
A ray of sunlight is passing from diamond into crown glass; the
angle of incidence is...
asked 11 months ago -
A block of mass 0.249 kg is placed on top of a light, vertical
spring of...
asked 11 months ago -
how do the kidneys compensate in the presences of acidosis
a) trigger hyperventilate
b) reserve acid...
asked 11 months ago -
Question 501 pts
The rental rate of capital to the firm increases. Which of the
following...
asked 11 months ago