
Homework Answers
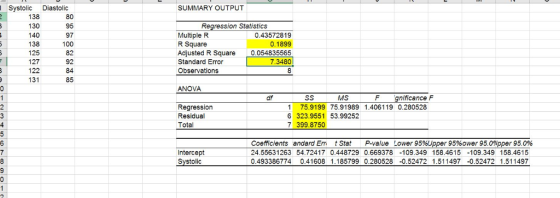
a) Explained Variation = 75.9199
b) Unexplained variation = 323.9551
c) Total Variation = 399.8750
d) R2 = 0.1899
d) Standard Error = 7.3480
Add Answer to:
Bio500 4.18.19 Quiz: Module 6 Quiz This Question: 1 pt 13 of 16 (11 complete) Eight different medical students took...
Quiz: Quiz CH 10811 Submit Quiz This Question: 1 pt 9 of 15 (1 complete) This...
 Quiz: Quiz CH 10811 Submit Quiz This Question: 1 pt 9 of 15 (1 complete) This Quiz: 15 pts possibl The data show systolic and diastolic blood pressure of certain people. Find the regression equation, letting the systolic reading be the independent (x) variable. Find the best predicted diastolic pressure for a person with a systolic reading of 113. Is the predicted value close to 72.7, which was the actual diastolic reading? Use a significance level of 0.05. Systolic Diastolic...
The accompanying table lists st o od pressure (mmHg) and diastolic blood pressures of a females...
 The accompanying table lists st o od pressure (mmHg) and diastolic blood pressures of a females Find the (a) explained variation, unexplained variation, and (c) prediction interval for a systolic blood pressure of 122 mm Hg using a 99% confidence level. There is sufficient evidence to support a claim of a linear correlation, so it is reasonable to use the regression equation when making predictions Click the icon to view the blood pressure data. a. The explained variation is (Round...
This Question: 1 pt 10 of 14 (10 complete)This Test: 14 pts possible Show Work Question...
 This Question: 1 pt 10 of 14 (10 complete)This Test: 14 pts possible Show Work Question Help A sample of blood pressure measurements is taken for a group of adults, and those values (mm Hg) are listed below. The values are matched so that 10 subjects each have a systolic and diastolic measurement. Find the coefficient of variation for each of the two samples; then compare the variation. Systolic 120 126 160 98 157 120 118 138 125 118 D...
The table shows the avrage wookly wages (n dollars) for state govemment eplnyeesand deral govemment employees for 8 yeans. The equation of the regression line is y 1.479x-78 874 Complete pa...
 The table shows the avrage wookly wages (n dollars) for state govemment eplnyeesand deral govemment employees for 8 yeans. The equation of the regression line is y 1.479x-78 874 Complete parts (a) and (b) below Weekly Wages ( 794 (a) Find the coefficient of deteemination and intepret the resu Round to three decimal places as needed. How can the ooefficient of determination be interpreted? The coeficient of deseminasion is the fraction ol the variation in average weekly wages for he...
& 9.3.11-T Question Help The number of initial public offerings of stock issued in a 10-year period and the total proceeds of these offerings (in milions) are shown in the table. The equatio...
 & 9.3.11-T Question Help The number of initial public offerings of stock issued in a 10-year period and the total proceeds of these offerings (in milions) are shown in the table. The equation of the regression line is 46.320x 18,843.16. Complete parts a and b , 406 461 688 499 498 377 57 69192 153 Proceeds, 17,893 28,654 42,827 31,617 67.306 65,407 21,402 11,244 31,691 27,878 The coefficient of determination is the fraction of the variation in proceeds that is...
The length of time in yours took a random sample of 32 forkers to quit smoking...
 The length of time in yours took a random sample of 32 forkers to quit smoking permanentyrested in the population standard deviation is 630.00, is there enough evidence to the claim that the man time to smokers to gut smoking permanenty i 13 yos? Complete parts) 127 87 104 123 103 174 117 22.10 165 159 204 16.5 144 174 15.1 162 223 10.7 17.5 16.7 107 224 32 156 112184 11.1 1 197 2211553 (a) Identity the chain and...
The table shows the number of goals allowed and the total points earned (2 points for...
 The table shows the number of goals allowed and the total points earned (2 points for a win, and 1 point for an overtime or shoc season. The equation of the regression line is y = -0.600x + 225.826. Use the data to answer the following questions. (a) Find the coefficient of determination, and interpret the result. (b) Find the standard error of the estimate, se, and interpret the result. Goals 212 210 219 223 259 258 273 200 217...
An instructor asked a random sample of eight students to record their study times at the...
 An instructor asked a random sample of eight students to record their study times at the beginning of a course. She then made a table for total hours studied (x) over 2 weeks and test score (y) at the end of the 2 weeks. The table is given below. Complete parts (a) through (d). X 11 1512 208 15 16 21 0 y 91 76 83 75 89 77 80 80 Ex= 118, Ey= 651, Exy = 9,464, Ex2 =...
Quiz: Chapter 4 Part 1 Review Submit This Question: 1 pt 3 of 16 (2 complete)...
 Quiz: Chapter 4 Part 1 Review Submit This Question: 1 pt 3 of 16 (2 complete) This Quiz: 16 pts poss The table shows the age-adjusted death rates per 100,000 citizens for heart disease in a certain country Complete parts (a) through (c) below 1976 1978 Death Rate 258.4 245 9 233.9 222 5 211.7 Year 1970 1972 1974 (a) Find an exponential model for these data, where t 0 corresponds to the year 1970. If you do not have...
***PLEASE DO ALL THIS IS MY LAST QUESTION OF THE GIVEN AMOUNT OF QUESTIONS :( *** Which value of r indicates a stronger correlation:r 0.751 orr0.896? Explain your reasoning Choose the correct answer...
 ***PLEASE DO ALL THIS IS MY LAST QUESTION OF THE GIVEN AMOUNT OF
QUESTIONS :( ***
Which value of r indicates a stronger correlation:r 0.751 orr0.896? Explain your reasoning Choose the correct answer below. A. r=-0.896 represents a stronger correlation because 0.751 >-0.896. B. r=0.751 represents a stronger correlation because l-08961-10.751. C· r--0 896 represents a stronger correlation because 1-0 8961-10751. D. 0.751 represents a stronger correlation because 0.751> -0.896. The budget (in millions of dollars) and worldwide gross (in...
***PLEASE DO ALL THIS IS MY LAST QUESTION OF THE GIVEN AMOUNT OF
QUESTIONS :( ***
Which value of r indicates a stronger correlation:r 0.751 orr0.896? Explain your reasoning Choose the correct answer below. A. r=-0.896 represents a stronger correlation because 0.751 >-0.896. B. r=0.751 represents a stronger correlation because l-08961-10.751. C· r--0 896 represents a stronger correlation because 1-0 8961-10751. D. 0.751 represents a stronger correlation because 0.751> -0.896. The budget (in millions of dollars) and worldwide gross (in...
 Quiz: Quiz CH 10811 Submit Quiz This Question: 1 pt 9 of 15 (1 complete) This Quiz: 15 pts possibl The data show systolic and diastolic blood pressure of certain people. Find the regression equation, letting the systolic reading be the independent (x) variable. Find the best predicted diastolic pressure for a person with a systolic reading of 113. Is the predicted value close to 72.7, which was the actual diastolic reading? Use a significance level of 0.05. Systolic Diastolic...
 The accompanying table lists st o od pressure (mmHg) and diastolic blood pressures of a females Find the (a) explained variation, unexplained variation, and (c) prediction interval for a systolic blood pressure of 122 mm Hg using a 99% confidence level. There is sufficient evidence to support a claim of a linear correlation, so it is reasonable to use the regression equation when making predictions Click the icon to view the blood pressure data. a. The explained variation is (Round...
 This Question: 1 pt 10 of 14 (10 complete)This Test: 14 pts possible Show Work Question Help A sample of blood pressure measurements is taken for a group of adults, and those values (mm Hg) are listed below. The values are matched so that 10 subjects each have a systolic and diastolic measurement. Find the coefficient of variation for each of the two samples; then compare the variation. Systolic 120 126 160 98 157 120 118 138 125 118 D...
 The table shows the avrage wookly wages (n dollars) for state govemment eplnyeesand deral govemment employees for 8 yeans. The equation of the regression line is y 1.479x-78 874 Complete parts (a) and (b) below Weekly Wages ( 794 (a) Find the coefficient of deteemination and intepret the resu Round to three decimal places as needed. How can the ooefficient of determination be interpreted? The coeficient of deseminasion is the fraction ol the variation in average weekly wages for he...
 & 9.3.11-T Question Help The number of initial public offerings of stock issued in a 10-year period and the total proceeds of these offerings (in milions) are shown in the table. The equation of the regression line is 46.320x 18,843.16. Complete parts a and b , 406 461 688 499 498 377 57 69192 153 Proceeds, 17,893 28,654 42,827 31,617 67.306 65,407 21,402 11,244 31,691 27,878 The coefficient of determination is the fraction of the variation in proceeds that is...
 The length of time in yours took a random sample of 32 forkers to quit smoking permanentyrested in the population standard deviation is 630.00, is there enough evidence to the claim that the man time to smokers to gut smoking permanenty i 13 yos? Complete parts) 127 87 104 123 103 174 117 22.10 165 159 204 16.5 144 174 15.1 162 223 10.7 17.5 16.7 107 224 32 156 112184 11.1 1 197 2211553 (a) Identity the chain and...
 The table shows the number of goals allowed and the total points earned (2 points for a win, and 1 point for an overtime or shoc season. The equation of the regression line is y = -0.600x + 225.826. Use the data to answer the following questions. (a) Find the coefficient of determination, and interpret the result. (b) Find the standard error of the estimate, se, and interpret the result. Goals 212 210 219 223 259 258 273 200 217...
 An instructor asked a random sample of eight students to record their study times at the beginning of a course. She then made a table for total hours studied (x) over 2 weeks and test score (y) at the end of the 2 weeks. The table is given below. Complete parts (a) through (d). X 11 1512 208 15 16 21 0 y 91 76 83 75 89 77 80 80 Ex= 118, Ey= 651, Exy = 9,464, Ex2 =...
 Quiz: Chapter 4 Part 1 Review Submit This Question: 1 pt 3 of 16 (2 complete) This Quiz: 16 pts poss The table shows the age-adjusted death rates per 100,000 citizens for heart disease in a certain country Complete parts (a) through (c) below 1976 1978 Death Rate 258.4 245 9 233.9 222 5 211.7 Year 1970 1972 1974 (a) Find an exponential model for these data, where t 0 corresponds to the year 1970. If you do not have...
 ***PLEASE DO ALL THIS IS MY LAST QUESTION OF THE GIVEN AMOUNT OF
QUESTIONS :( ***
Which value of r indicates a stronger correlation:r 0.751 orr0.896? Explain your reasoning Choose the correct answer below. A. r=-0.896 represents a stronger correlation because 0.751 >-0.896. B. r=0.751 represents a stronger correlation because l-08961-10.751. C· r--0 896 represents a stronger correlation because 1-0 8961-10751. D. 0.751 represents a stronger correlation because 0.751> -0.896. The budget (in millions of dollars) and worldwide gross (in...
***PLEASE DO ALL THIS IS MY LAST QUESTION OF THE GIVEN AMOUNT OF
QUESTIONS :( ***
Which value of r indicates a stronger correlation:r 0.751 orr0.896? Explain your reasoning Choose the correct answer below. A. r=-0.896 represents a stronger correlation because 0.751 >-0.896. B. r=0.751 represents a stronger correlation because l-08961-10.751. C· r--0 896 represents a stronger correlation because 1-0 8961-10751. D. 0.751 represents a stronger correlation because 0.751> -0.896. The budget (in millions of dollars) and worldwide gross (in...
Most questions answered within 3 hours.
-
Where is the error in this code sequence?
String s1 = "Hello";
String s2 = "ello";...
asked 10 months ago -
Financial data for Joel de Paris, Inc., for last year
follow:
Joel de Paris, Inc.
Balance...
asked 10 months ago -
Consider this reaction:
Al2(SO4)3 (aq)+ BaCl3
(aq) Al2Cl6 (aq)- +
3BaSO4(s) . What is the...
asked 10 months ago -
Suppose that Savneet is considering increasing her
recent random sample from 20 car rentals to 40...
asked 10 months ago -
Trucks arrive at an unloading terminal at an average rate of 120
per hour.
Trucks arrive...
asked 10 months ago -
Why are methanol and ethanol completely soluble in water while
octanol is not very little soluble....
asked 10 months ago -
A facilities manager at a university reads in a research report
that the mean amount of...
asked 10 months ago -
When the CuSO4 is rehydrated by adding water to the anhydrous
compound, is this an endothermic...
asked 10 months ago -
A ray of sunlight is passing from diamond into crown glass; the
angle of incidence is...
asked 10 months ago -
A block of mass 0.249 kg is placed on top of a light, vertical
spring of...
asked 10 months ago -
how do the kidneys compensate in the presences of acidosis
a) trigger hyperventilate
b) reserve acid...
asked 10 months ago -
Question 501 pts
The rental rate of capital to the firm increases. Which of the
following...
asked 10 months ago