
Homework Answers
Graph 1

Graph 2

Graph 3

Effective population size is the sum of all populations given. It is an ideal population size.
Mean population size is the ratio of effective population size to the number of generations.
| Case | effective population size (add all given populations) | mean population size (effective population size/4) |
| 1 | 800 | 200 |
| 2 | 800 | 200 |
| 3 | 800 | 200 |
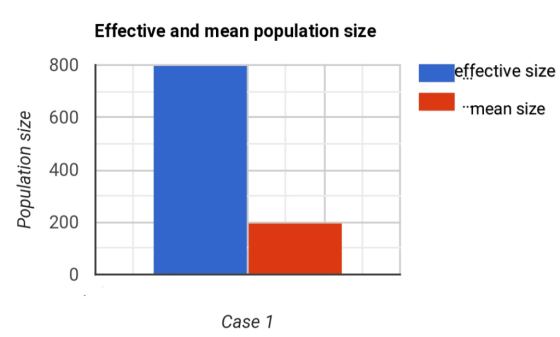
All the three cases will have same graph for effective and mean population size.
Part 2
Effective population size = 4(number of breeding males)(number of breeding females)/number of breeding males + number of breeding females
A. 4(50)(50)/50+50 = 10,000/100 = 100
B. 4(25)(75)/25+75 = 7500/100 = 75
C. 4(10)(90)/10+90 = 3200/100 = 32
Please rate.
Add Answer to:
Part 1 Consider the following three populations, each followed over 4 generations Population 1: N =...
Simulate the following population system: There are 100 mitochondrial DNA (mDNA) groups, each with 100 members,...
 Simulate the following population system: There are 100 mitochondrial DNA (mDNA) groups, each with 100 members, 50 male and 50 Write a program to simulate population growth, tracking the sizes of mDNA groups. To simplify, assume the members of the population marry at random and that they have children in distinct generations. For each generation, marry males and females picked at random, and assign each family 0, 1, 2, or 3 children, each randomly male or female, P(male) Plfemale).5, and...
#2 Consider the following model for the dynamics of a population of size N (measured as number of...
 #2 Consider the following model for the dynamics of a population of size N (measured as number of individuals x 10) over time (in months) that is subject to harvesting: The population grows according to a logistic equation in the absence of harvesting and h is a constant per a) Find all equilibria and determine the values of h for which each is stable or unstable. 4aestng andcnstant capita harvest rate. b) Construct the bifurcation plot: plot the equilibria from...
Independent random samples of n = 100 observations each are drawn from normal populations. The parameters...
Independent random samples of n = 100 observations each are drawn from normal populations. The parameters of these populations are: • Population 1: μ1 = 300 and σ1 = 60; • Population 2: μ2 = 290 and σ2 = 80. (1) What is the probability that the mean of Population 1 is between 294 and 306? (2) How many samples should be included if we want the probability in Part (1) to be at least 95%? (3) What is the...
Pictured below (in scrambled order) are three histograms: One of them represents a population distribution. The...
 Pictured below (in scrambled order) are three histograms: One of them represents a population distribution. The other two are sampling distributions of x-bar; one for sample size n = 5, and one for sample size n = 30. Histogram 1: 400 300 Frequency 200 100 0 3 6 9 12 15 18 21 24 Histogram 2: 800 700 600 500 Frequency 400 300 200 100 0 0 12 15 18 21 24 Histogram 3: 350 300 250 200 Frequency 150...
Thanks ahead of time!!! Problem 2: Modeling inseet population dynamies The use of arrays and matrix...
 Thanks ahead of time!!!
Problem 2: Modeling inseet population dynamies The use of arrays and matrix algebra are ideal for modeling population dynamics of organisms. If n) is computed from represents the number of organisms at time t, then the number at a later time, t+1, can be n(t+1) An(t). The array (vector, n) consists of the nurnber of females in each age class, and the array (matrix, A), called a Leslie matrix, is the survival- replacement matrix. Multiplying the...
Thanks ahead of time!!!
Problem 2: Modeling inseet population dynamies The use of arrays and matrix algebra are ideal for modeling population dynamics of organisms. If n) is computed from represents the number of organisms at time t, then the number at a later time, t+1, can be n(t+1) An(t). The array (vector, n) consists of the nurnber of females in each age class, and the array (matrix, A), called a Leslie matrix, is the survival- replacement matrix. Multiplying the...
Suppose we are interested in estimating the proportion p of a population that has a certain disease. As in Section 2.3 let y;-1 if person i has the disease, and yi 0 if person i does not have the dis...
 Suppose we are interested in estimating the proportion p of a population that has a certain disease. As in Section 2.3 let y;-1 if person i has the disease, and yi 0 if person i does not have the disease. Then p . a Show, using the definition in (2.13), that 22 N- np If the population is large and the sampling fraction is small, so that write (2.26) in terms of the CV for a sample of size 1....
1-There is a population of individuals which are geographically isolated from other populations of their species....
 1-There is a population of individuals which are
geographically isolated from other populations of their species.
Their population mates randomly, has no net mutations in their
genome, and is not subjected to natural selection pressures.
However, their population is small, only 200 individuals. The gene
for fur color in this population has two alleles in a
dominant-recessive relationship, A and a. If allele A is currently
at a frequency of 0.8 and allele a is at 0.2:
i. What do...
1-There is a population of individuals which are
geographically isolated from other populations of their species.
Their population mates randomly, has no net mutations in their
genome, and is not subjected to natural selection pressures.
However, their population is small, only 200 individuals. The gene
for fur color in this population has two alleles in a
dominant-recessive relationship, A and a. If allele A is currently
at a frequency of 0.8 and allele a is at 0.2:
i. What do...
In C++ Transient Population Populations are effected by the birth and death rate, as well as...
In C++ Transient Population Populations are effected by the birth and death rate, as well as the number of people who move in and out each year. The birth rate is the percentage increase of the population due to births and the death rate is the percentage decrease of the population due to deaths. Write a program that displays the size of a population for any number of years. The program should ask for the following data: The starting size...
Sampling results for 12 quadrats. Density (individuals/100 cm) Adults Juveniles 1 Quadrat Coordinates 2.8 7,9 7,4...
 Sampling results for 12 quadrats. Density (individuals/100 cm) Adults Juveniles 1 Quadrat Coordinates 2.8 7,9 7,4 5.9 3,8 1 0 1 14 2 D 0 3 6 1 0 0 0 2 0 0 0 0 5 0 0 2,10 8,5 9.8 4,5 9,7 3,1 7,2 Average Density (individuals/100 cm Estimated Sample Size (N) 1 . Use these steps to calculate the population size (N): Calculate the average density per cell (10 cm x 10 cm square). Enter the average...
1. A researcher sets up 100 replicate population cages. Each is founded with 20 Drosophila melanogaster...
1. A researcher sets up 100 replicate population cages. Each is founded with 20 Drosophila melanogaster individuals, drawn from a population that is polymorphic for the L1 and L2alleles at a neutral pseudogene locus L. After many months the L1 allele is fixed in 11 of the cages and the L2 allele is fixed in 89 of the cages. Estimate the frequencies of the L1 and L2 alleles in the original population from which these cages were founded. 2. In...
 Simulate the following population system: There are 100 mitochondrial DNA (mDNA) groups, each with 100 members, 50 male and 50 Write a program to simulate population growth, tracking the sizes of mDNA groups. To simplify, assume the members of the population marry at random and that they have children in distinct generations. For each generation, marry males and females picked at random, and assign each family 0, 1, 2, or 3 children, each randomly male or female, P(male) Plfemale).5, and...
 #2 Consider the following model for the dynamics of a population of size N (measured as number of individuals x 10) over time (in months) that is subject to harvesting: The population grows according to a logistic equation in the absence of harvesting and h is a constant per a) Find all equilibria and determine the values of h for which each is stable or unstable. 4aestng andcnstant capita harvest rate. b) Construct the bifurcation plot: plot the equilibria from...
 Pictured below (in scrambled order) are three histograms: One of them represents a population distribution. The other two are sampling distributions of x-bar; one for sample size n = 5, and one for sample size n = 30. Histogram 1: 400 300 Frequency 200 100 0 3 6 9 12 15 18 21 24 Histogram 2: 800 700 600 500 Frequency 400 300 200 100 0 0 12 15 18 21 24 Histogram 3: 350 300 250 200 Frequency 150...
 Thanks ahead of time!!!
Problem 2: Modeling inseet population dynamies The use of arrays and matrix algebra are ideal for modeling population dynamics of organisms. If n) is computed from represents the number of organisms at time t, then the number at a later time, t+1, can be n(t+1) An(t). The array (vector, n) consists of the nurnber of females in each age class, and the array (matrix, A), called a Leslie matrix, is the survival- replacement matrix. Multiplying the...
Thanks ahead of time!!!
Problem 2: Modeling inseet population dynamies The use of arrays and matrix algebra are ideal for modeling population dynamics of organisms. If n) is computed from represents the number of organisms at time t, then the number at a later time, t+1, can be n(t+1) An(t). The array (vector, n) consists of the nurnber of females in each age class, and the array (matrix, A), called a Leslie matrix, is the survival- replacement matrix. Multiplying the...
 Suppose we are interested in estimating the proportion p of a population that has a certain disease. As in Section 2.3 let y;-1 if person i has the disease, and yi 0 if person i does not have the disease. Then p . a Show, using the definition in (2.13), that 22 N- np If the population is large and the sampling fraction is small, so that write (2.26) in terms of the CV for a sample of size 1....
 1-There is a population of individuals which are
geographically isolated from other populations of their species.
Their population mates randomly, has no net mutations in their
genome, and is not subjected to natural selection pressures.
However, their population is small, only 200 individuals. The gene
for fur color in this population has two alleles in a
dominant-recessive relationship, A and a. If allele A is currently
at a frequency of 0.8 and allele a is at 0.2:
i. What do...
1-There is a population of individuals which are
geographically isolated from other populations of their species.
Their population mates randomly, has no net mutations in their
genome, and is not subjected to natural selection pressures.
However, their population is small, only 200 individuals. The gene
for fur color in this population has two alleles in a
dominant-recessive relationship, A and a. If allele A is currently
at a frequency of 0.8 and allele a is at 0.2:
i. What do...
 Sampling results for 12 quadrats. Density (individuals/100 cm) Adults Juveniles 1 Quadrat Coordinates 2.8 7,9 7,4 5.9 3,8 1 0 1 14 2 D 0 3 6 1 0 0 0 2 0 0 0 0 5 0 0 2,10 8,5 9.8 4,5 9,7 3,1 7,2 Average Density (individuals/100 cm Estimated Sample Size (N) 1 . Use these steps to calculate the population size (N): Calculate the average density per cell (10 cm x 10 cm square). Enter the average...
Most questions answered within 3 hours.
-
Where is the error in this code sequence?
String s1 = "Hello";
String s2 = "ello";...
asked 10 months ago -
Financial data for Joel de Paris, Inc., for last year
follow:
Joel de Paris, Inc.
Balance...
asked 10 months ago -
Consider this reaction:
Al2(SO4)3 (aq)+ BaCl3
(aq) Al2Cl6 (aq)- +
3BaSO4(s) . What is the...
asked 10 months ago -
Suppose that Savneet is considering increasing her
recent random sample from 20 car rentals to 40...
asked 10 months ago -
Trucks arrive at an unloading terminal at an average rate of 120
per hour.
Trucks arrive...
asked 10 months ago -
Why are methanol and ethanol completely soluble in water while
octanol is not very little soluble....
asked 10 months ago -
A facilities manager at a university reads in a research report
that the mean amount of...
asked 10 months ago -
When the CuSO4 is rehydrated by adding water to the anhydrous
compound, is this an endothermic...
asked 10 months ago -
A ray of sunlight is passing from diamond into crown glass; the
angle of incidence is...
asked 10 months ago -
A block of mass 0.249 kg is placed on top of a light, vertical
spring of...
asked 10 months ago -
how do the kidneys compensate in the presences of acidosis
a) trigger hyperventilate
b) reserve acid...
asked 10 months ago -
Question 501 pts
The rental rate of capital to the firm increases. Which of the
following...
asked 10 months ago