An elite university in New York recently became concerned about a number of the young women...
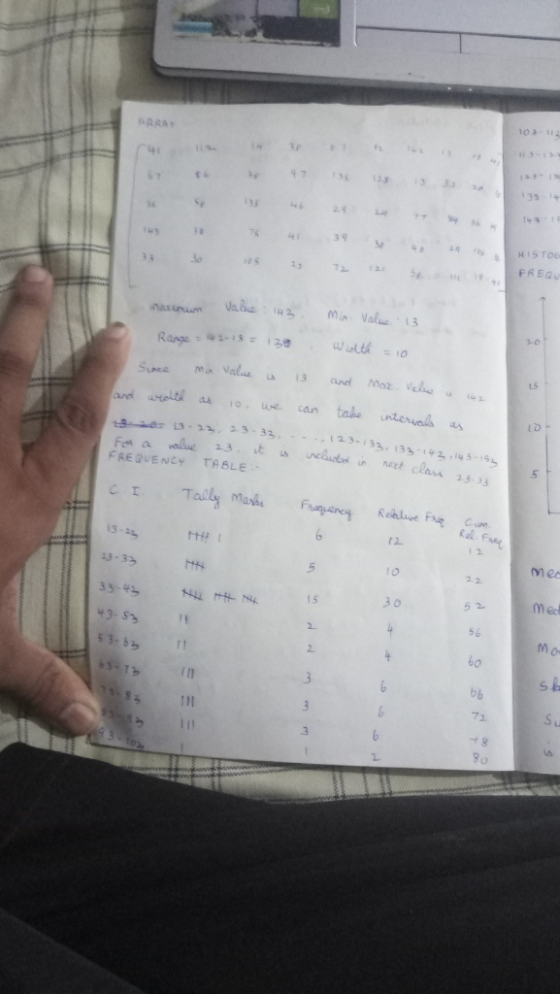
An elite university in New York recently became concerned about a number of the young women in their dance program. The administration had been informed that many of these women had joined "diet" clubs, often sacrificing health in the pursuit of extreme thinness. The administration was concerned about the long term consequences of such diets including damage to critical systems (e.g., bones, heart, etc.) and the development of eating disorders. All dance students, with their informed consent, went through health screenings and then a program of education was enacted to improve healthly living and wellbeing. One measure taken was iron levels (normal iron blood levels of adult women are 40 - 150 micrograms per deciliter (mcg/dL)). The human body needs iron so it can make hemoglobin, a substance in red blood cells that carries oxygen from the lungs to body tissues. Iron is also needed for energy, good muscle and organ function. Below are data from the 50 young women in the program.
|
41 |
112 |
14 |
38 |
67 |
92 |
142 |
13 |
28 |
41 |
|
67 |
86 |
38 |
97 |
135 |
128 |
13 |
33 |
20 |
78 |
|
35 |
58 |
135 |
46 |
29 |
24 |
77 |
84 |
36 |
49 |
|
143 |
38 |
75 |
41 |
39 |
38 |
40 |
29 |
106 |
56 |
|
33 |
30 |
105 |
23 |
72 |
121 |
38 |
111 |
19 |
41 |
- In the space below, arrange your data into an array.
- Select your intervals. Explain your rationale for the intervals you selected.
- Construct a frequency table. Remember, your frequency table should include class interval, frequency, relative frequency and cumulative relative frequency.
- On a separate page, construct a histogram based on your table. Take a photo with your phone or an image file with your printer and insert on a separate page at the end of this homework or send as a separate jpg file. Or insert your image below.
- On a separate page, construct a frequency polygon based on your table. Take a photo with your phone or an image file with your printer and insert on a separate page at the end of this homework or send as a separate jpg file. Or insert your image below.
- Find the mean, median, and mode for the data.
- Mean = Median = Mode = .
- Is the data in question one skewed? Why or why not?
- You are a journalist who has attended this event. Write a short newspaper article describing the event and outcome. Remember that it needs to look like a newspaper article and your readers are not a bunch of statisticians!
Homework Answers


 pages order is 2,1,3,4 and
5
pages order is 2,1,3,4 and
5
Add Answer to:
An elite university in New York recently became concerned about a number of the young women...
The incubation rates for the mysterious "O" Virus has been recorded in days. The number of...
The incubation rates for the mysterious "O" Virus has been recorded in days. The number of days ranges from 5 - 37. 05 06 22 23 34 17 17 26 37 25 17 10 30 06 22 33 06 22 10 27 10 37 13 26 19 27 21 31 22 15 14 28 17 13 28 22 34 17 13 10 In the space below, arrange your data into an array. Select your intervals. Explain your rationale for the...
This Test: 45 pts pos Find the indicated z-scores shown in the graph Click to view.page...
 This Test: 45 pts pos Find the indicated z-scores shown in the graph Click to view.page 1 of the Standard Normal Table The z-scores are Use a comma to separate answers as needed Round to two decimal places as needed ) Find the indicated probability using the standard normal distribution. P(z > 2.02) Click here to view page 1 of the standard normal table, Click here to view page 2 of the standard normal table P(Z> 2.02)(Round to four decimal...
AO OUR CITY Department of the Treasury Service OMB Number Form 13614-C 2010 Intake/Interview & Quality...
 AO OUR CITY Department of the Treasury Service OMB Number Form 13614-C 2010 Intake/Interview & Quality Review Sheet You will need . Please complete pages 14 of this form, - Tax Information such as Forms W-2 100 100 1095 - You are responsible for the information on your return. Please provide - Social security cards or ITIN letters for persons on your tax retum complete and accurate information Picture D uchas valid driver's license for you and your spouse. ....
All of the following questions are in relation to the following journal article which is available...
 All of the following questions are in relation to the following journal article which is available on Moodle: Parr CL, Magnus MC, Karlstad O, Holvik K, Lund-Blix NA, Jaugen M, et al. Vitamin A and D intake in pregnancy, infant supplementation and asthma development: the Norwegian Mother and Child Cohort. Am J Clin Nutr 2018:107:789-798 QUESTIONS: 1. State one hypothesis the author's proposed in the manuscript. 2. There is previous research that shows that adequate Vitamin A intake is required...
 This Test: 45 pts pos Find the indicated z-scores shown in the graph Click to view.page 1 of the Standard Normal Table The z-scores are Use a comma to separate answers as needed Round to two decimal places as needed ) Find the indicated probability using the standard normal distribution. P(z > 2.02) Click here to view page 1 of the standard normal table, Click here to view page 2 of the standard normal table P(Z> 2.02)(Round to four decimal...
 AO OUR CITY Department of the Treasury Service OMB Number Form 13614-C 2010 Intake/Interview & Quality Review Sheet You will need . Please complete pages 14 of this form, - Tax Information such as Forms W-2 100 100 1095 - You are responsible for the information on your return. Please provide - Social security cards or ITIN letters for persons on your tax retum complete and accurate information Picture D uchas valid driver's license for you and your spouse. ....
 All of the following questions are in relation to the following journal article which is available on Moodle: Parr CL, Magnus MC, Karlstad O, Holvik K, Lund-Blix NA, Jaugen M, et al. Vitamin A and D intake in pregnancy, infant supplementation and asthma development: the Norwegian Mother and Child Cohort. Am J Clin Nutr 2018:107:789-798 QUESTIONS: 1. State one hypothesis the author's proposed in the manuscript. 2. There is previous research that shows that adequate Vitamin A intake is required...
Most questions answered within 3 hours.
-
Where is the error in this code sequence?
String s1 = "Hello";
String s2 = "ello";...
asked 11 months ago -
Financial data for Joel de Paris, Inc., for last year
follow:
Joel de Paris, Inc.
Balance...
asked 11 months ago -
Consider this reaction:
Al2(SO4)3 (aq)+ BaCl3
(aq) Al2Cl6 (aq)- +
3BaSO4(s) . What is the...
asked 11 months ago -
Suppose that Savneet is considering increasing her
recent random sample from 20 car rentals to 40...
asked 11 months ago -
Trucks arrive at an unloading terminal at an average rate of 120
per hour.
Trucks arrive...
asked 11 months ago -
Why are methanol and ethanol completely soluble in water while
octanol is not very little soluble....
asked 11 months ago -
A facilities manager at a university reads in a research report
that the mean amount of...
asked 11 months ago -
When the CuSO4 is rehydrated by adding water to the anhydrous
compound, is this an endothermic...
asked 11 months ago -
A ray of sunlight is passing from diamond into crown glass; the
angle of incidence is...
asked 11 months ago -
A block of mass 0.249 kg is placed on top of a light, vertical
spring of...
asked 11 months ago -
how do the kidneys compensate in the presences of acidosis
a) trigger hyperventilate
b) reserve acid...
asked 11 months ago -
Question 501 pts
The rental rate of capital to the firm increases. Which of the
following...
asked 11 months ago