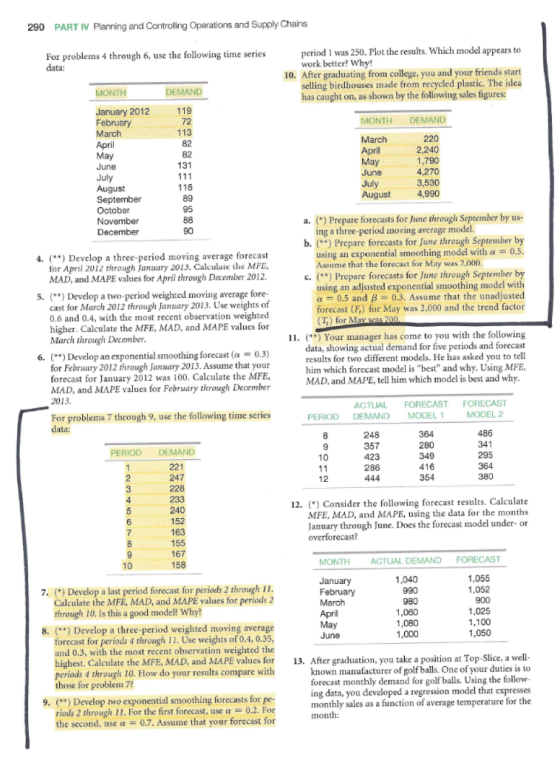
Please help with questions 7 - 10.
Homework Answers
Q7.
Last period Forecast and Error analysis is following:
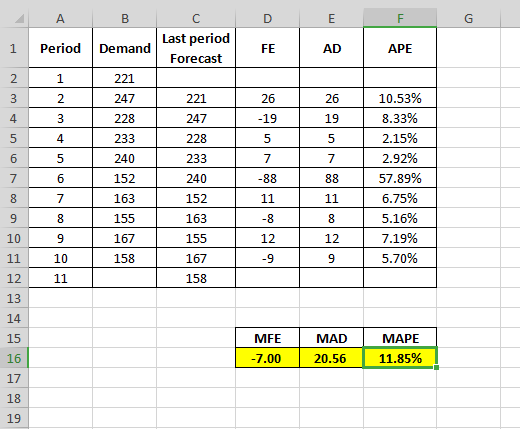
EXCEL FORMULAS:
| Period | Demand | Last period Forecast | FE | AD | APE |
| 1 | 221 | ||||
| 2 | 247 | =B2 | =B3-C3 | =ABS(D3) | =E3/B3 |
| 3 | 228 | =B3 | =B4-C4 | =ABS(D4) | =E4/B4 |
| 4 | 233 | =B4 | =B5-C5 | =ABS(D5) | =E5/B5 |
| 5 | 240 | =B5 | =B6-C6 | =ABS(D6) | =E6/B6 |
| 6 | 152 | =B6 | =B7-C7 | =ABS(D7) | =E7/B7 |
| 7 | 163 | =B7 | =B8-C8 | =ABS(D8) | =E8/B8 |
| 8 | 155 | =B8 | =B9-C9 | =ABS(D9) | =E9/B9 |
| 9 | 167 | =B9 | =B10-C10 | =ABS(D10) | =E10/B10 |
| 10 | 158 | =B10 | =B11-C11 | =ABS(D11) | =E11/B11 |
| 11 | =B11 | ||||
| MFE | MAD | MAPE | |||
| =AVERAGE(D3:D11) | =AVERAGE(E3:E11) | =AVERAGE(F3:F11) |
MAPE is nearly 12% , which is significantly high. Therefore, this is not a good model.
Add Answer to:
Please help with questions 7 - 10. PART IV Planning and Controling Operations and Supply Chains...
For problerms 7 througl use the following time serles data:l Th fol PERIOD DEMAND 221 247 228 233...
 Use
excel, show excel commands. #8
For problerms 7 througl use the following time serles data:l Th fol PERIOD DEMAND 221 247 228 233 240 152 163 155 167 158 4 5 7 10 7. () Develop a last period forecast for periods 2 through 11. Calculate the MFE, MAD, and MAPE values for periods 2 through 10. Is this a good model? Why? 8. () Develop a three-period weighted moving average forecast for periods 4 through 11. Use weights...
Use
excel, show excel commands. #8
For problerms 7 througl use the following time serles data:l Th fol PERIOD DEMAND 221 247 228 233 240 152 163 155 167 158 4 5 7 10 7. () Develop a last period forecast for periods 2 through 11. Calculate the MFE, MAD, and MAPE values for periods 2 through 10. Is this a good model? Why? 8. () Develop a three-period weighted moving average forecast for periods 4 through 11. Use weights...
Please help. Im stuck on the exponential smoothing part of this problem. Here are the actual...
Please help. Im stuck on the exponential smoothing part of this problem. Here are the actual tabulated demands for an item for a nine-month period (January through September). Your supervisor wants to test two forecasting methods to see which method was better over this period. MONTH ACTUAL January 110 February 130 March 150 April 170 May 160 June 180 July 140 August 130 September 140 a. Forecast April through September using a three-month moving average. (Round your answers to 1...
Homework: Homework #2 Score: 0 of 4 pts Problem 22 Save 5 of 22 (17 complete)>...
 Homework: Homework #2 Score: 0 of 4 pts Problem 22 Save 5 of 22 (17 complete)> HYV Score: 60%, 18 of 30 pt 1,4 Show Work | Question Help * Consider the following forecast results. Calculate MFE, MAD, and MAPE, using the data for the months January through June. Does the forecast model under-or overforecast? Actual Demand 1,008 972 923 1,059 1.137 991 Month Forecast January February March April May June 1,061 1,042 910 1,014 1,127 1,035 The MFE is(Enter...
Here are the actual tabulated demands for an item for a nine-month period (January through September)....
Here are the actual tabulated demands for an item for a nine-month period (January through September). Your supervisor wants to test two forecasting methods to see which method was better over this period. MONTH ACTUAL January 110 February 130 March 150 April 170 May 160 June 180 July 140 August 130 September 140 A. Forecast April through September using a three-month moving average. B. Use simple exponential smoothing with an alpha of 0.3 to estimate April through...
Problem 22 Consider the following forecast results. Caloulate MFE, MAD, and MAPE, using the data for...
 Problem 22 Consider the following forecast results. Caloulate MFE, MAD, and MAPE, using the data for the months January through June. Does the forecast model under- or overforecast? Actual Forecast Month Demand January February March 968 1,091 1,089 1,063 1,054 898 1,029 1,113 June 1,013 1.100 The MFE slag (Enter your response rounded to one decimal place and include The MAD is(Enter your response rounded to one decimal place,) a minus sign if necessary)
Name 1. Observations of the demand for a certain part stocked at a parts supply depot during the ...
 Name 1. Observations of the demand for a certain part stocked at a parts supply depot during the calendar year 1999 were Month Janua Demand 89 57 144 221 Februa March ril Ma June Jul August September October November December 280 223 286 212 275 188 312 Determine the forecasts for July though December of the year 1999 considering 2, 3, and 6- month moving averages Compute the MAD for the obtained forecasts. Which method gave you better results? Determine...
Question 4 [12 marks] Sales of commercial elevators at Armsteel Co. over the 12 months were...
Question 4 [12 marks] Sales of commercial elevators at Armsteel Co. over the 12 months were as below: Month Sales Month Sales January 898 July 900 February 1325 August 1502 March 1250 September 1311 April 1008 October 899 May 1497 November 1311 June 1186 December 1074 Use three-period weighted moving average with weights 0.5, 0.3, 0.2 (0.5 = most recent) to forecast the forecast for April and May. Show your works in the Excel. (label the tab in Excel spreadsheet...
The historical sales for a certain model of a single serve coffee maker at a specialty...
The historical sales for a certain model of a single serve coffee maker at a specialty cookware store in units is: January, 22; February, 17; March, 18; April, 24; May, 16, and June, 15. Use single exponential smoothing with α = 0.2, and compute the exponential smoothing forecasts for February through June. Do not round intermediate calculations. Round your answers to two decimal places. Month Observation Forecast January 22 22 February 17 March 18 April 24 May 16 June 15
The Period is 3 for Forecasting 1. A plot of the number of customers at Aceite...
 The Period is 3 for Forecasting
1. A plot of the number of customers at Aceite Lube Center shows the number of weekly customers is not subject to a trend or season. Using the data below a) Develop a forecast using simple moving average with 3 months b) Develop a forecast using weighted moving average with n -3, w 0.5, W2 0.4, W3 0.1 c) Develop an exponential smoothing forecast using F 190 and a 0.65 MonthCustomersMonth September 189 February...
The Period is 3 for Forecasting
1. A plot of the number of customers at Aceite Lube Center shows the number of weekly customers is not subject to a trend or season. Using the data below a) Develop a forecast using simple moving average with 3 months b) Develop a forecast using weighted moving average with n -3, w 0.5, W2 0.4, W3 0.1 c) Develop an exponential smoothing forecast using F 190 and a 0.65 MonthCustomersMonth September 189 February...
Question 1 Part A The following table shows the best forecast for a time series representing...
Question 1 Part A The following table shows the best forecast for a time series representing the number of people (in thousands) who have two or more jobs in the United States Date Jobs Forecast May 2013 6,487 6,788 June 2013 6,284 6,523 July 2013 6,253 6,279 August 2013 6,840 6,336 Calculate the MAD (mean absolute deviation) forecasting accuracy measurement. Take all calculations to three decimal places. Part B Based on the actual and forecasted returns shown below, calculate the...
 Use
excel, show excel commands. #8
For problerms 7 througl use the following time serles data:l Th fol PERIOD DEMAND 221 247 228 233 240 152 163 155 167 158 4 5 7 10 7. () Develop a last period forecast for periods 2 through 11. Calculate the MFE, MAD, and MAPE values for periods 2 through 10. Is this a good model? Why? 8. () Develop a three-period weighted moving average forecast for periods 4 through 11. Use weights...
Use
excel, show excel commands. #8
For problerms 7 througl use the following time serles data:l Th fol PERIOD DEMAND 221 247 228 233 240 152 163 155 167 158 4 5 7 10 7. () Develop a last period forecast for periods 2 through 11. Calculate the MFE, MAD, and MAPE values for periods 2 through 10. Is this a good model? Why? 8. () Develop a three-period weighted moving average forecast for periods 4 through 11. Use weights...
 Homework: Homework #2 Score: 0 of 4 pts Problem 22 Save 5 of 22 (17 complete)> HYV Score: 60%, 18 of 30 pt 1,4 Show Work | Question Help * Consider the following forecast results. Calculate MFE, MAD, and MAPE, using the data for the months January through June. Does the forecast model under-or overforecast? Actual Demand 1,008 972 923 1,059 1.137 991 Month Forecast January February March April May June 1,061 1,042 910 1,014 1,127 1,035 The MFE is(Enter...
 Problem 22 Consider the following forecast results. Caloulate MFE, MAD, and MAPE, using the data for the months January through June. Does the forecast model under- or overforecast? Actual Forecast Month Demand January February March 968 1,091 1,089 1,063 1,054 898 1,029 1,113 June 1,013 1.100 The MFE slag (Enter your response rounded to one decimal place and include The MAD is(Enter your response rounded to one decimal place,) a minus sign if necessary)
 Name 1. Observations of the demand for a certain part stocked at a parts supply depot during the calendar year 1999 were Month Janua Demand 89 57 144 221 Februa March ril Ma June Jul August September October November December 280 223 286 212 275 188 312 Determine the forecasts for July though December of the year 1999 considering 2, 3, and 6- month moving averages Compute the MAD for the obtained forecasts. Which method gave you better results? Determine...
 The Period is 3 for Forecasting
1. A plot of the number of customers at Aceite Lube Center shows the number of weekly customers is not subject to a trend or season. Using the data below a) Develop a forecast using simple moving average with 3 months b) Develop a forecast using weighted moving average with n -3, w 0.5, W2 0.4, W3 0.1 c) Develop an exponential smoothing forecast using F 190 and a 0.65 MonthCustomersMonth September 189 February...
The Period is 3 for Forecasting
1. A plot of the number of customers at Aceite Lube Center shows the number of weekly customers is not subject to a trend or season. Using the data below a) Develop a forecast using simple moving average with 3 months b) Develop a forecast using weighted moving average with n -3, w 0.5, W2 0.4, W3 0.1 c) Develop an exponential smoothing forecast using F 190 and a 0.65 MonthCustomersMonth September 189 February...
Most questions answered within 3 hours.
-
Where is the error in this code sequence?
String s1 = "Hello";
String s2 = "ello";...
asked 11 months ago -
Financial data for Joel de Paris, Inc., for last year
follow:
Joel de Paris, Inc.
Balance...
asked 11 months ago -
Consider this reaction:
Al2(SO4)3 (aq)+ BaCl3
(aq) Al2Cl6 (aq)- +
3BaSO4(s) . What is the...
asked 11 months ago -
Suppose that Savneet is considering increasing her
recent random sample from 20 car rentals to 40...
asked 11 months ago -
Trucks arrive at an unloading terminal at an average rate of 120
per hour.
Trucks arrive...
asked 11 months ago -
Why are methanol and ethanol completely soluble in water while
octanol is not very little soluble....
asked 11 months ago -
A facilities manager at a university reads in a research report
that the mean amount of...
asked 11 months ago -
When the CuSO4 is rehydrated by adding water to the anhydrous
compound, is this an endothermic...
asked 11 months ago -
A ray of sunlight is passing from diamond into crown glass; the
angle of incidence is...
asked 11 months ago -
A block of mass 0.249 kg is placed on top of a light, vertical
spring of...
asked 11 months ago -
how do the kidneys compensate in the presences of acidosis
a) trigger hyperventilate
b) reserve acid...
asked 11 months ago -
Question 501 pts
The rental rate of capital to the firm increases. Which of the
following...
asked 11 months ago