
Paragraph Styles Favorite television show type Cumulative Frequency Percent Valid Percent Percent Valid Comedy 70 7.0 7.0 7.0 Drama 176 17.6 17.6 24.6 Movies/Miniseries 195 19.5 19.5 44.1 Documentary 254 25.4 25.4 69.5 Reality 76 7.6 7.6 77.1 Science Fiction 71 7.1 7.1 84.2 Sports 158 15.8 15.8 100.0 Total 1000 100.0 100.0 Favorite radio genre Cumulative Frequency Percent Valid Percent Percent Valid Classic pop & rock 116 11.6 11.6 11.6 Country 131 13.1 13.1 24.7 Easy listening 82 8.2 8.2 32.9 Jazz & blues 159 15.9 15.9 48.8 Pop & Chart 400 40.0 40.0 88.8 Talk 112 11.2 11.2 100.0 Total 1000 100.0 100.0
Paragraph Styles Favorite magazine type Cumulative Frequency Valid Percent Percent Percent Valid Business & money 74 7,4 7.4 7.4 Music & entertainment 140 14.0 14.0 21.4 Family & parenting 254 25.4 25.4 46.8 Sports & outdoors 119 11.9 11.9 58.7 Home & garden 62 6.2 6.2 64.9 Cooking, food & wine 57 5.7 5.7 70.6 74.7 Trucks, Cars & Motorcycles 41 4.1 4.1 News, politics & current 253 25.3 25,3 100.0 events 1000 100,0 100.0 Total Copyright 2017 Pearson Education, Inc.
Favorite local newspaper section Cumulative Frequency Percent Valid Percent Percent Editorial Valid 94 9.4 9.4 9.4 Business 204 20.4 20.4 29.8 Local news 31.7 317 31.7 61.5 National news 41 4.1 65.6 4.1 Sports 236 23.6 89.2 23.6 Entertainment 59 5.9 5.9 95.1 Do not read 49 4.9 100.0 4.9 Total 1000 100.0 100.0
Homework Answers
Research based on the sample shows the results of traditional media usage is given.
Below is the summary of insights from the sample research.
"Television" media:
Top favorite television show type in the order of preference as per the sample is Documentary (25.4%), Movies (19.5%), Drama (17.6%) and Sports (15.8%). Top 2 constitutes 44.9%, top 3 constitutes 62.5% and top 4 constitutes 78.3% of total preference from the sample.
"Radio" media:
Top favorite radio genre in the order of preference as per the sample is Pop & Chart (40%), Jazz & Blues (15.9%) and Country(13.1%). Top 1 constitutes 40.0%, top 2 constitutes 55.9% and top 3 constitutes 69% of total preference from the sample.
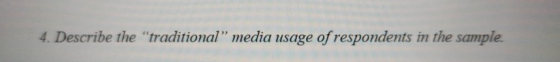
"Magazine" media:
Top favorite magazine type in the order of preference as per the sample is Family & Parenting (25.4%), News, Politics & Current events (25.3%) and Music & Entertainment (14%). Top 2 constitutes 50.7% and top 3 constitutes 64.7% of total preference from the sample.
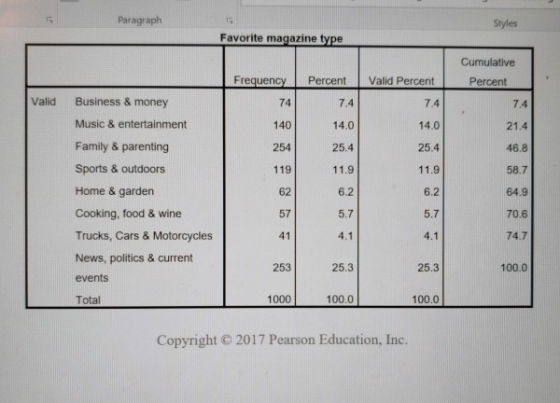
"Local Newspaper" media:
Top favorite local newspaper in the order of preference as per the sample is local news (31.7%), Sports (23.6%) and Business (20.4%). Top 2 constitutes 55.3% and top 3 constitutes 75.7% of total preference from the sample.
Overall, few additional insights from the data
- "Newspaper" is a preferred media for "Business"
- "Television" and "Newspaper" is a preferred media for "Sports"
If you liked my answer, please give like/ thumbs up. Thank you!
Add Answer to:
4. Describe the "traditional" media usage of respondents in the sample Paragraph Styles Favorite television show...
Describe the "traditional" media usage of respondents in the sample ? Please use the below table...
Describe the "traditional" media usage of respondents in the sample ? Please use the below table to answer above question. Favorite radio genre Favorite radio genre, table, 1 levels of column headers and 2 levels of row headers, table with 6 columns and 9 rows Frequency Percent Valid Percent Cumulative Percent Valid Classic pop & rock 116 11.6 11.6 11.6 Country 131 13.1 13.1 24.7 Easy listening 82 8.2 8.2 32.9 Jazz & blues 159 15.9 15.9 48.8 Pop &...
Describe the social media usage of the respondents in the sample ? Below are the sample...
Describe the social media usage of the respondents in the sample ? Below are the sample of the respondents you just have to explain below table Please use below table to answer the below question Frequency Table Frequency Table - Use of online blogs - January 24, 2019 Use of online blogs Use of online blogs, table, 1 levels of column headers and 2 levels of row headers, table with 6 columns and 7 rows Frequency Percent Valid Percent Cumulative...
can u clearly show me how to find a sample size (N) , A2, and can...
 can u clearly show me how to find a sample size (N) , A2, and
can you also tell me why we are using an X Chart?
Problem 1 A restaurant wants to control kitchen preparation time of dinner meals using an X chart. The process standard deviation is unknown. Each evening a manager takes a random sample of 14 dinner orders and measures and records their kitchen preparation time. Create an X Chart using data in the table below...
can u clearly show me how to find a sample size (N) , A2, and
can you also tell me why we are using an X Chart?
Problem 1 A restaurant wants to control kitchen preparation time of dinner meals using an X chart. The process standard deviation is unknown. Each evening a manager takes a random sample of 14 dinner orders and measures and records their kitchen preparation time. Create an X Chart using data in the table below...
CASE 1-5 Financial Statement Ratio Computation Refer to Campbell Soup Company's financial Campbell Soup statements in...
 CASE 1-5 Financial Statement Ratio Computation Refer to Campbell Soup Company's financial Campbell Soup statements in Appendix A. Required: Compute the following ratios for Year 11. Liquidity ratios: Asset utilization ratios:* a. Current ratio n. Cash turnover b. Acid-test ratio 0. Accounts receivable turnover c. Days to sell inventory p. Inventory turnover d. Collection period 4. Working capital turnover Capital structure and solvency ratios: 1. Fixed assets turnover e. Total debt to total equity s. Total assets turnover f. Long-term...
 can u clearly show me how to find a sample size (N) , A2, and
can you also tell me why we are using an X Chart?
Problem 1 A restaurant wants to control kitchen preparation time of dinner meals using an X chart. The process standard deviation is unknown. Each evening a manager takes a random sample of 14 dinner orders and measures and records their kitchen preparation time. Create an X Chart using data in the table below...
can u clearly show me how to find a sample size (N) , A2, and
can you also tell me why we are using an X Chart?
Problem 1 A restaurant wants to control kitchen preparation time of dinner meals using an X chart. The process standard deviation is unknown. Each evening a manager takes a random sample of 14 dinner orders and measures and records their kitchen preparation time. Create an X Chart using data in the table below...
 CASE 1-5 Financial Statement Ratio Computation Refer to Campbell Soup Company's financial Campbell Soup statements in Appendix A. Required: Compute the following ratios for Year 11. Liquidity ratios: Asset utilization ratios:* a. Current ratio n. Cash turnover b. Acid-test ratio 0. Accounts receivable turnover c. Days to sell inventory p. Inventory turnover d. Collection period 4. Working capital turnover Capital structure and solvency ratios: 1. Fixed assets turnover e. Total debt to total equity s. Total assets turnover f. Long-term...
Most questions answered within 3 hours.
-
Where is the error in this code sequence?
String s1 = "Hello";
String s2 = "ello";...
asked 10 months ago -
Financial data for Joel de Paris, Inc., for last year
follow:
Joel de Paris, Inc.
Balance...
asked 10 months ago -
Consider this reaction:
Al2(SO4)3 (aq)+ BaCl3
(aq) Al2Cl6 (aq)- +
3BaSO4(s) . What is the...
asked 10 months ago -
Suppose that Savneet is considering increasing her
recent random sample from 20 car rentals to 40...
asked 10 months ago -
Trucks arrive at an unloading terminal at an average rate of 120
per hour.
Trucks arrive...
asked 10 months ago -
Why are methanol and ethanol completely soluble in water while
octanol is not very little soluble....
asked 10 months ago -
A facilities manager at a university reads in a research report
that the mean amount of...
asked 10 months ago -
When the CuSO4 is rehydrated by adding water to the anhydrous
compound, is this an endothermic...
asked 10 months ago -
A ray of sunlight is passing from diamond into crown glass; the
angle of incidence is...
asked 10 months ago -
A block of mass 0.249 kg is placed on top of a light, vertical
spring of...
asked 10 months ago -
how do the kidneys compensate in the presences of acidosis
a) trigger hyperventilate
b) reserve acid...
asked 10 months ago -
Question 501 pts
The rental rate of capital to the firm increases. Which of the
following...
asked 10 months ago