
Homework Answers
Add Answer to:
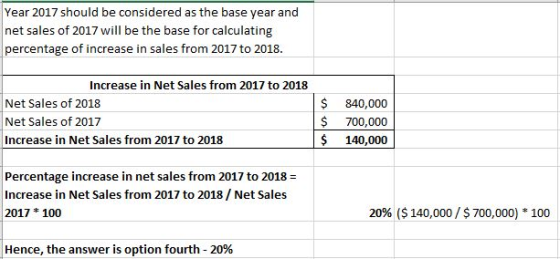
The following income statement information is available: 2018 2017 Net Sales $ 840,000 $700,000 Cost of...
Tamarisk, Inc. reported the following in its 2017 and 2016 income statements. 2017 2016 Net sales Cost of goods sol...
 Tamarisk, Inc. reported the following in its 2017 and 2016 income statements. 2017 2016 Net sales Cost of goods sold Operating expenses $230,000 135,700 59,590 17,000 $ 17,710 $140,000 82,600 23,220 8,000 $ 26,180 Income tax expense Net income Determine the company's gross profit rate and profit margin for both years. (Round profit margin answers to 1 decimal place, e3.52.7.) 2017 2016 Gross profit rate Profit margin
XYZ Inc. Income Statement 2018 2017 Sales &nb
XYZ Inc. Income Statement 2018 2017 Sales 950000 800,000 COGS 650000 600000 Gross Profit 300000 200000 Operating costs (excluding depreciation) 50000 60,000 EDITDA 250,000 140000 Depreciation 20000 18,000 EBIT 230000 122,000 Interest Expense 100000 100,000 EBT 130000 22,000 Taxes 25000 5,000 Net Income 105,000 17,000 Common Dividends 6000 4000 Addition to Retained Earnings 99000 13,000 2018 2017 Year-end stock price $50 $40 # of shares 5500 3500 Find the Ratios for 2018: EPS: P/E:
2018 2017 Income Statement Information Sales revenue Cost of goods sold Net income $ $ 10,440,000...
 2018 2017 Income Statement Information Sales revenue Cost of goods sold Net income $ $ 10,440,000 6,827,760 360,000 8,400,000 5,900,000 248,000 Balance Sheet Information Current assets Long-term assets $ 1,600,000 2,200,000 $ 1,500,000 1,900,000 Total assets $ 3,800,000 $ 3,400,000 $ Current liabilities Long-term liabilities Common stock Retained earnings 1.200,000 1,500,000 800,000 300,000 900.000 1,500,000 800,000 200,000 Total liabilities and stockholders' equity 3,800,000 $ 3,400,000 Required: 1. Calculate the following profitability ratios for 2018 (Round your answers to 1 decimal...
Haskins Inc. reported the following 2017 income statement ($ thousands): 2017 Total Revenue $550,460 Cost of...
Haskins Inc. reported the following 2017 income statement ($ thousands): 2017 Total Revenue $550,460 Cost of Revenue 262,810 Gross Profit 287,650 Selling, General and Administrative Expenses 95,740 Other Expenses 22,780 Operating Income $169,130 Forecast 2018 operating income assuming a 2% increase in sales. Assume that the 2017 percentage relation of expenses to total revenue continue to hold in 2018.
Brief Exercise 5-10 In 2018, Modder Corporation reported net sales of $250,000, cost of goods sold...
 Brief Exercise 5-10 In 2018, Modder Corporation reported net sales of $250,000, cost of goods sold of $137,500, operating expenses of $50,000, and income tax expense of $20,000. In 2017, it reported net sales of $200,000, cost of goods sold of $114,000, operating expenses of $40,000, other revenu $10,000, and income tax expense of $15,000. Calculate the gross profit and net income for each year. 2018 2017 Gross profit $ Net income Calculate the gross profit margin and profit margin...
In 2018, Martinez Corporation reported net sales of $232,900, cost of goods sold of $139,700, operating expenses of $45,...
 In 2018, Martinez Corporation reported net sales of $232,900,
cost of goods sold of $139,700, operating expenses of $45,500, and
income tax expense of $21,600. In 2017, it reported net sales of
$213,000, cost of goods sold of $103,700, operating expenses of
$39,000, other revenues of $10,300, and income tax expense of
$13,700.
Calculate the gross profit and net income for each year. 2018 2017 Gross profit Net income $ LINK TO TEXT LINK TO TEXT Calculate the gross profit...
In 2018, Martinez Corporation reported net sales of $232,900,
cost of goods sold of $139,700, operating expenses of $45,500, and
income tax expense of $21,600. In 2017, it reported net sales of
$213,000, cost of goods sold of $103,700, operating expenses of
$39,000, other revenues of $10,300, and income tax expense of
$13,700.
Calculate the gross profit and net income for each year. 2018 2017 Gross profit Net income $ LINK TO TEXT LINK TO TEXT Calculate the gross profit...
Presented below is the comparative income statement of Edison Company for 2018 and 2017. Edison Company...
Presented below is the comparative income statement of Edison Company for 2018 and 2017. Edison Company Income Statement For the Year Ended November 30 2018 2017 Sales $188,611 $123,848 Cost of Goods Sold $110,424 $64,407 Gross Profit $78,187 $59,441 Operating Expenses Administrative Expense $21,184 $10,508 Selling Expense $27,225 $22,419 Total Operating Expenses $48,409 $32,927 Other Income and Expenses Interest Expense $1,251 $867 Income Before Income Tax $28,527 $25,647 Income Tax $8,558 $7,694 Net Income (Loss) $19,969 $17,953 a) Calculate the...
Sheridan Company reported net sales $700,000; cost of goods sold $455,000; operating expenses $183,750; and net...
 Sheridan Company reported net sales $700,000; cost of goods sold $455,000; operating expenses $183,750; and net income $59,500 Calculate the profit margin and gross profit rate. (Round answers to 1 decimal place, es. 10.2%) Profit margin Gross profit rate
Micatin Designs, Inc. Comparative Income Statement Years Ended December 31, 2018 and 2017 2018 2017 Net...
 Micatin Designs, Inc. Comparative Income Statement Years Ended December 31, 2018 and 2017 2018 2017 Net Sales Revenue $ 432,000 $375,000 Expenses: Cost of Goods Sold 201,000 186,250 Selling and Administrative Expenses 100,250 8,500 92,000 2,150 Other Expenses 309,750 Total Expenses 280,400 $ 122,250 $ 94,600 Net Income 1. Prepare a comparative common-size income statement for Mieatin Designs, Inc. using the 2018 and 2017 data. Round percentages to one-tenth percent 2. To an investor, how does 2018 compare with 2017?...
Brief Exercise 5-14 Bramble Corp. reported net sales $840,000; cost of goods sold $546,000; operating expenses...
 Brief Exercise 5-14 Bramble Corp. reported net sales $840,000; cost of goods sold $546,000; operating expenses $220,500; and net income $71,400. Calculate the profit margin and gross profit rate. (Round answers to 1 decimal place, e.g. 10.2%.) Profit margin Gross profit rate
 Tamarisk, Inc. reported the following in its 2017 and 2016 income statements. 2017 2016 Net sales Cost of goods sold Operating expenses $230,000 135,700 59,590 17,000 $ 17,710 $140,000 82,600 23,220 8,000 $ 26,180 Income tax expense Net income Determine the company's gross profit rate and profit margin for both years. (Round profit margin answers to 1 decimal place, e3.52.7.) 2017 2016 Gross profit rate Profit margin
 2018 2017 Income Statement Information Sales revenue Cost of goods sold Net income $ $ 10,440,000 6,827,760 360,000 8,400,000 5,900,000 248,000 Balance Sheet Information Current assets Long-term assets $ 1,600,000 2,200,000 $ 1,500,000 1,900,000 Total assets $ 3,800,000 $ 3,400,000 $ Current liabilities Long-term liabilities Common stock Retained earnings 1.200,000 1,500,000 800,000 300,000 900.000 1,500,000 800,000 200,000 Total liabilities and stockholders' equity 3,800,000 $ 3,400,000 Required: 1. Calculate the following profitability ratios for 2018 (Round your answers to 1 decimal...
 Brief Exercise 5-10 In 2018, Modder Corporation reported net sales of $250,000, cost of goods sold of $137,500, operating expenses of $50,000, and income tax expense of $20,000. In 2017, it reported net sales of $200,000, cost of goods sold of $114,000, operating expenses of $40,000, other revenu $10,000, and income tax expense of $15,000. Calculate the gross profit and net income for each year. 2018 2017 Gross profit $ Net income Calculate the gross profit margin and profit margin...
 In 2018, Martinez Corporation reported net sales of $232,900,
cost of goods sold of $139,700, operating expenses of $45,500, and
income tax expense of $21,600. In 2017, it reported net sales of
$213,000, cost of goods sold of $103,700, operating expenses of
$39,000, other revenues of $10,300, and income tax expense of
$13,700.
Calculate the gross profit and net income for each year. 2018 2017 Gross profit Net income $ LINK TO TEXT LINK TO TEXT Calculate the gross profit...
In 2018, Martinez Corporation reported net sales of $232,900,
cost of goods sold of $139,700, operating expenses of $45,500, and
income tax expense of $21,600. In 2017, it reported net sales of
$213,000, cost of goods sold of $103,700, operating expenses of
$39,000, other revenues of $10,300, and income tax expense of
$13,700.
Calculate the gross profit and net income for each year. 2018 2017 Gross profit Net income $ LINK TO TEXT LINK TO TEXT Calculate the gross profit...
 Sheridan Company reported net sales $700,000; cost of goods sold $455,000; operating expenses $183,750; and net income $59,500 Calculate the profit margin and gross profit rate. (Round answers to 1 decimal place, es. 10.2%) Profit margin Gross profit rate
 Micatin Designs, Inc. Comparative Income Statement Years Ended December 31, 2018 and 2017 2018 2017 Net Sales Revenue $ 432,000 $375,000 Expenses: Cost of Goods Sold 201,000 186,250 Selling and Administrative Expenses 100,250 8,500 92,000 2,150 Other Expenses 309,750 Total Expenses 280,400 $ 122,250 $ 94,600 Net Income 1. Prepare a comparative common-size income statement for Mieatin Designs, Inc. using the 2018 and 2017 data. Round percentages to one-tenth percent 2. To an investor, how does 2018 compare with 2017?...
 Brief Exercise 5-14 Bramble Corp. reported net sales $840,000; cost of goods sold $546,000; operating expenses $220,500; and net income $71,400. Calculate the profit margin and gross profit rate. (Round answers to 1 decimal place, e.g. 10.2%.) Profit margin Gross profit rate
Most questions answered within 3 hours.
-
Where is the error in this code sequence?
String s1 = "Hello";
String s2 = "ello";...
asked 10 months ago -
Financial data for Joel de Paris, Inc., for last year
follow:
Joel de Paris, Inc.
Balance...
asked 10 months ago -
Consider this reaction:
Al2(SO4)3 (aq)+ BaCl3
(aq) Al2Cl6 (aq)- +
3BaSO4(s) . What is the...
asked 10 months ago -
Suppose that Savneet is considering increasing her
recent random sample from 20 car rentals to 40...
asked 10 months ago -
Trucks arrive at an unloading terminal at an average rate of 120
per hour.
Trucks arrive...
asked 10 months ago -
Why are methanol and ethanol completely soluble in water while
octanol is not very little soluble....
asked 10 months ago -
A facilities manager at a university reads in a research report
that the mean amount of...
asked 10 months ago -
When the CuSO4 is rehydrated by adding water to the anhydrous
compound, is this an endothermic...
asked 10 months ago -
A ray of sunlight is passing from diamond into crown glass; the
angle of incidence is...
asked 10 months ago -
A block of mass 0.249 kg is placed on top of a light, vertical
spring of...
asked 10 months ago -
how do the kidneys compensate in the presences of acidosis
a) trigger hyperventilate
b) reserve acid...
asked 10 months ago -
Question 501 pts
The rental rate of capital to the firm increases. Which of the
following...
asked 10 months ago