


Homework Answers
| Amount indicates in the $ billions | |||
| Total current asset | $ 14.23 | Billions | |
| Divided by: | Total current liabilities | $ 14.50 | Billions |
| Current Ratio | 0.98 | ||
| Current Ratio | 0.98:1 | ||
| Total liabilities | $ 31.00 | Billions | |
| Divided by: | Total assets | $ 34.64 | Billions |
| Debt Ratio | 89% | ||
Add Answer to:
What is the current ratio? (1:1)
What is the debt ratio? (%)
Show work please
1....
what is the current ratio? (1:1) what is the debt ratio? (%) please show work 1....
 what is the current ratio? (1:1)
what is the debt ratio? (%)
please show work
1. What is the current ratio? (1:1) 2. What is the debt ratio? (%) *Income Statement Income Statement Balance SheetCash Flow Statement Annual Financials Quarter Financials Quarterly Financials for Lowe's Cos. View Ratios All values USD millions. 31-Oct- 2018 31-Jan- 2019 30-Apr- 2019 31-Jul- 2019 31-Oct- 2019 5-qtr trend Sales/Revenue 17.42B 15.65B 17.74B 20.99B 7.39B Cost of Goods Sold (COGS) incl. D&A 12.19B 11.12B 12.46B...
what is the current ratio? (1:1)
what is the debt ratio? (%)
please show work
1. What is the current ratio? (1:1) 2. What is the debt ratio? (%) *Income Statement Income Statement Balance SheetCash Flow Statement Annual Financials Quarter Financials Quarterly Financials for Lowe's Cos. View Ratios All values USD millions. 31-Oct- 2018 31-Jan- 2019 30-Apr- 2019 31-Jul- 2019 31-Oct- 2019 5-qtr trend Sales/Revenue 17.42B 15.65B 17.74B 20.99B 7.39B Cost of Goods Sold (COGS) incl. D&A 12.19B 11.12B 12.46B...
What is the asset utilization for 2017 and 2018? 1 Annual Financials for Microsoft Corp. 2...
 What is the asset utilization for 2017 and 2018?
1 Annual Financials for Microsoft Corp. 2 Fiscal year is July-June. All values USD millions. Income Statement 2017 Sales Revenue 96.02 6 Cost of Goods Sold (COGS) incl. D&A 34.62 7 COGS excluding D&A 26.77 8 Depreciation & Amortization Expense 7.86 Depreciation 6.1 10 Amortization of Intangibles 1.76 Gross Income 61.4 2018 110.18 38.97 29.02 9.95 7.7 2.25 71.21 Fiscal year is October September. All values USD millions. Balance Sheet Assets...
What is the asset utilization for 2017 and 2018?
1 Annual Financials for Microsoft Corp. 2 Fiscal year is July-June. All values USD millions. Income Statement 2017 Sales Revenue 96.02 6 Cost of Goods Sold (COGS) incl. D&A 34.62 7 COGS excluding D&A 26.77 8 Depreciation & Amortization Expense 7.86 Depreciation 6.1 10 Amortization of Intangibles 1.76 Gross Income 61.4 2018 110.18 38.97 29.02 9.95 7.7 2.25 71.21 Fiscal year is October September. All values USD millions. Balance Sheet Assets...
Balance Sheet Assets Fiscal year is January-December. All values USD millions. 2017 Cash & Short Term...
Balance Sheet Assets Fiscal year is January-December. All values USD millions. 2017 Cash & Short Term Investments 18.3B Total Accounts Receivable 13.49B Inventories 8.77B Other Current Assets 2.54B Total Current Assets 43.09B 2017 Net Property, Plant & Equipment 17.01B Total Investments and Advances 751M Long-Term Note Receivable - Intangible Assets 85.13B Other Assets 4.22B Total Assets 157.3B Liabilities & Shareholders' Equity 2017 ST Debt & Current Portion LT Debt 3.91B Accounts Payable 7.31B Income Tax Payable 1.85B Other Current Liabilities...
Calculate the company's debt to total assets ratio (also called total debt ratio) for both the...
 Calculate the company's debt to total assets ratio (also called total debt ratio) for both the recent year and the prior year. Show your computations. Write the textbook formula here: Recent year: Prior year: Explain what information this ratio provides (define), and what the results mean to this company. Use complete sentences and your own words. Compare the two, has the ratio improved? The Procter& Gamble Company 37 Consolidated Statements of Earnings 2018 2017 2016 NET SALES S 66,832 S...
Income Statement 2014 2015 2016 2017 Sales/Revenue 55.87B 55.36B 59.39B 62.76B Cost of Goods Sold (COGS)...
 Income Statement
2014
2015
2016
2017
Sales/Revenue
55.87B
55.36B
59.39B
62.76B
Cost of Goods Sold (COGS) incl. D&A
20.52B
20.65B
23.43B
23.8B
COGS excluding D&A
11.97B
11.94B
15.64B
15.68B
Depreciation & Amortization Expense
8.55B
8.71B
7.79B
8.13B
Depreciation
7.38B
7.82B
6.27B
6.75B
Amortization of Intangibles
1.17B
890M
1.52B
1.38B
Gross Income
35.35B
34.7B
35.96B
38.96B
2014
2015
2016
2017
SG&A Expense
19.69B
19.84B
21.15B
20.62B
Research & Development
11.56B
11.95B
12.75B
13.14B
Other SG&A
8.14B
7.88B
8.4B
7.48B
Other Operating...
Income Statement
2014
2015
2016
2017
Sales/Revenue
55.87B
55.36B
59.39B
62.76B
Cost of Goods Sold (COGS) incl. D&A
20.52B
20.65B
23.43B
23.8B
COGS excluding D&A
11.97B
11.94B
15.64B
15.68B
Depreciation & Amortization Expense
8.55B
8.71B
7.79B
8.13B
Depreciation
7.38B
7.82B
6.27B
6.75B
Amortization of Intangibles
1.17B
890M
1.52B
1.38B
Gross Income
35.35B
34.7B
35.96B
38.96B
2014
2015
2016
2017
SG&A Expense
19.69B
19.84B
21.15B
20.62B
Research & Development
11.56B
11.95B
12.75B
13.14B
Other SG&A
8.14B
7.88B
8.4B
7.48B
Other Operating...
calculate the following financial indicators Current Ratio Debt/Equity Ratio Free Cash Flow Earnings...
 calculate the following financial
indicators
Current Ratio
Debt/Equity Ratio
Free Cash Flow
Earnings per Share
Price/Earnings Ratio
Return on Equity
Net Profit Margin
As Reported Annual Income Statement Report Date Currency Audit Status Consolidated Scale Net product sales Net services sales Total net sales Cost of sales Fulfillment expenses Marketing expenses Technology & content expenses General & administrative expenses Other operating expense (income), net Total operating expenses & costs Income from operations Interest income Interest expense...
calculate the following financial
indicators
Current Ratio
Debt/Equity Ratio
Free Cash Flow
Earnings per Share
Price/Earnings Ratio
Return on Equity
Net Profit Margin
As Reported Annual Income Statement Report Date Currency Audit Status Consolidated Scale Net product sales Net services sales Total net sales Cost of sales Fulfillment expenses Marketing expenses Technology & content expenses General & administrative expenses Other operating expense (income), net Total operating expenses & costs Income from operations Interest income Interest expense...
Given the Balance Sheet and Income Statement calculate the follow ratios (must include calculations): profit ratio,...
 Given the Balance Sheet and Income Statement calculate the
follow ratios (must include calculations):
profit ratio, liquidity ratio, activity ratio, leverage ratio,
shareholder return ratio
Balance Sheet All numbers in thousands A Get access to 15+ years of historical data with Yahoo Financ Breakdown 12/31/2019 v Assets v Current Assets v Cash Cash And Cash Equivalents 2,594,000 Short Term Investments Total Cash 2,594,000 Net Receivables 25,429,000 Inventory 1,422,000 Other Current Assets Total Current Assets 37,473,000 Total Current Assets 37,473,000 Non-current...
Given the Balance Sheet and Income Statement calculate the
follow ratios (must include calculations):
profit ratio, liquidity ratio, activity ratio, leverage ratio,
shareholder return ratio
Balance Sheet All numbers in thousands A Get access to 15+ years of historical data with Yahoo Financ Breakdown 12/31/2019 v Assets v Current Assets v Cash Cash And Cash Equivalents 2,594,000 Short Term Investments Total Cash 2,594,000 Net Receivables 25,429,000 Inventory 1,422,000 Other Current Assets Total Current Assets 37,473,000 Total Current Assets 37,473,000 Non-current...
Income Statement Sales/Revenue Total revenue 76,480,000,000 Cost of Revenue 25,110,000,000 Gross Profit 51,370,000,000 Operating Exp 31,810,000,000...
Income Statement Sales/Revenue Total revenue 76,480,000,000 Cost of Revenue 25,110,000,000 Gross Profit 51,370,000,000 Operating Exp 31,810,000,000 Selling General & Admin - Other Operating Expense 3,390,000,000 Unusual Expense 16,180,000,000 EBIT after Unusual Expense 2,130,000,000 Non Operating Income/Expense 385,000,000 Equity in Affiliates (Pretax) 1,020,000,000 Interest Expense 17,670,000,000 Pretax Income 16,370,000,000 Other After Tax Income (Expense) 1,300,000,000 Consolidated Net Income - Minority Interest Expense 1,300,000,000 Net Income - Discontinued Operations 1,300,000,000 Net Income After Extraordinaries - Preferred Dividends 1,300,000,000 Net Income Available to...
what is the dupont EBT using avg assets equity what is the tax burden? INCOME STATEMENT...
 what is the dupont EBT using avg assets equity
what is the tax burden?
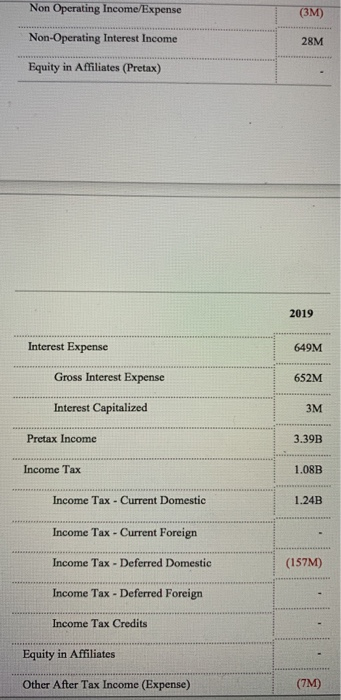
INCOME STATEMENT Sales/Revenue COGS excluding D&A Depreciation & Amortization Expense Gross Income EBIT SG&A Expense Unusual Expense Interest Expense Pretax Income Income Tax - Current Domestic Consolidated Net Income 2020 19,974 11,990 1,067 6,917 5,705 104 207 901 159 691 2019 20,229 12,199 964 7,066 5,601 167 256 1,042 272 801 BALANCE SHEET Cash & Short Term Investments Total Accounts Receivable Inventories Other Current Assets Miscellaneous...
what is the dupont EBT using avg assets equity
what is the tax burden?
INCOME STATEMENT Sales/Revenue COGS excluding D&A Depreciation & Amortization Expense Gross Income EBIT SG&A Expense Unusual Expense Interest Expense Pretax Income Income Tax - Current Domestic Consolidated Net Income 2020 19,974 11,990 1,067 6,917 5,705 104 207 901 159 691 2019 20,229 12,199 964 7,066 5,601 167 256 1,042 272 801 BALANCE SHEET Cash & Short Term Investments Total Accounts Receivable Inventories Other Current Assets Miscellaneous...
Download and review the financial statements of Ascension Health-a non-profit organization. Ascension Consolidated Balance Sheets (Dollars...
Download and review the financial statements of Ascension Health-a non-profit organization. Ascension Consolidated Balance Sheets (Dollars in Thousands) December 31, June 30, 2017 2017 Assets (unaudited) Current assets: Cash and cash equivalents 473,278 $ 857,605 $ Short-term investments 115,018 103,857 Accounts receivable, less allowance for doubtful accounts ($1,255,955 and $1,316,163 at December 31, 2017 and June 30, 2017, respectively) 2,817,396 2,758,554 Inventories 355,150 354,041 Due from brokers (see Notes 4 and 5) 108,494 197,195 Estimated third-party payor settlements 202,236 133,715 ...
 what is the current ratio? (1:1)
what is the debt ratio? (%)
please show work
1. What is the current ratio? (1:1) 2. What is the debt ratio? (%) *Income Statement Income Statement Balance SheetCash Flow Statement Annual Financials Quarter Financials Quarterly Financials for Lowe's Cos. View Ratios All values USD millions. 31-Oct- 2018 31-Jan- 2019 30-Apr- 2019 31-Jul- 2019 31-Oct- 2019 5-qtr trend Sales/Revenue 17.42B 15.65B 17.74B 20.99B 7.39B Cost of Goods Sold (COGS) incl. D&A 12.19B 11.12B 12.46B...
what is the current ratio? (1:1)
what is the debt ratio? (%)
please show work
1. What is the current ratio? (1:1) 2. What is the debt ratio? (%) *Income Statement Income Statement Balance SheetCash Flow Statement Annual Financials Quarter Financials Quarterly Financials for Lowe's Cos. View Ratios All values USD millions. 31-Oct- 2018 31-Jan- 2019 30-Apr- 2019 31-Jul- 2019 31-Oct- 2019 5-qtr trend Sales/Revenue 17.42B 15.65B 17.74B 20.99B 7.39B Cost of Goods Sold (COGS) incl. D&A 12.19B 11.12B 12.46B...
 What is the asset utilization for 2017 and 2018?
1 Annual Financials for Microsoft Corp. 2 Fiscal year is July-June. All values USD millions. Income Statement 2017 Sales Revenue 96.02 6 Cost of Goods Sold (COGS) incl. D&A 34.62 7 COGS excluding D&A 26.77 8 Depreciation & Amortization Expense 7.86 Depreciation 6.1 10 Amortization of Intangibles 1.76 Gross Income 61.4 2018 110.18 38.97 29.02 9.95 7.7 2.25 71.21 Fiscal year is October September. All values USD millions. Balance Sheet Assets...
What is the asset utilization for 2017 and 2018?
1 Annual Financials for Microsoft Corp. 2 Fiscal year is July-June. All values USD millions. Income Statement 2017 Sales Revenue 96.02 6 Cost of Goods Sold (COGS) incl. D&A 34.62 7 COGS excluding D&A 26.77 8 Depreciation & Amortization Expense 7.86 Depreciation 6.1 10 Amortization of Intangibles 1.76 Gross Income 61.4 2018 110.18 38.97 29.02 9.95 7.7 2.25 71.21 Fiscal year is October September. All values USD millions. Balance Sheet Assets...
 Calculate the company's debt to total assets ratio (also called total debt ratio) for both the recent year and the prior year. Show your computations. Write the textbook formula here: Recent year: Prior year: Explain what information this ratio provides (define), and what the results mean to this company. Use complete sentences and your own words. Compare the two, has the ratio improved? The Procter& Gamble Company 37 Consolidated Statements of Earnings 2018 2017 2016 NET SALES S 66,832 S...
 Income Statement
2014
2015
2016
2017
Sales/Revenue
55.87B
55.36B
59.39B
62.76B
Cost of Goods Sold (COGS) incl. D&A
20.52B
20.65B
23.43B
23.8B
COGS excluding D&A
11.97B
11.94B
15.64B
15.68B
Depreciation & Amortization Expense
8.55B
8.71B
7.79B
8.13B
Depreciation
7.38B
7.82B
6.27B
6.75B
Amortization of Intangibles
1.17B
890M
1.52B
1.38B
Gross Income
35.35B
34.7B
35.96B
38.96B
2014
2015
2016
2017
SG&A Expense
19.69B
19.84B
21.15B
20.62B
Research & Development
11.56B
11.95B
12.75B
13.14B
Other SG&A
8.14B
7.88B
8.4B
7.48B
Other Operating...
Income Statement
2014
2015
2016
2017
Sales/Revenue
55.87B
55.36B
59.39B
62.76B
Cost of Goods Sold (COGS) incl. D&A
20.52B
20.65B
23.43B
23.8B
COGS excluding D&A
11.97B
11.94B
15.64B
15.68B
Depreciation & Amortization Expense
8.55B
8.71B
7.79B
8.13B
Depreciation
7.38B
7.82B
6.27B
6.75B
Amortization of Intangibles
1.17B
890M
1.52B
1.38B
Gross Income
35.35B
34.7B
35.96B
38.96B
2014
2015
2016
2017
SG&A Expense
19.69B
19.84B
21.15B
20.62B
Research & Development
11.56B
11.95B
12.75B
13.14B
Other SG&A
8.14B
7.88B
8.4B
7.48B
Other Operating...
 calculate the following financial
indicators
Current Ratio
Debt/Equity Ratio
Free Cash Flow
Earnings per Share
Price/Earnings Ratio
Return on Equity
Net Profit Margin
As Reported Annual Income Statement Report Date Currency Audit Status Consolidated Scale Net product sales Net services sales Total net sales Cost of sales Fulfillment expenses Marketing expenses Technology & content expenses General & administrative expenses Other operating expense (income), net Total operating expenses & costs Income from operations Interest income Interest expense...
calculate the following financial
indicators
Current Ratio
Debt/Equity Ratio
Free Cash Flow
Earnings per Share
Price/Earnings Ratio
Return on Equity
Net Profit Margin
As Reported Annual Income Statement Report Date Currency Audit Status Consolidated Scale Net product sales Net services sales Total net sales Cost of sales Fulfillment expenses Marketing expenses Technology & content expenses General & administrative expenses Other operating expense (income), net Total operating expenses & costs Income from operations Interest income Interest expense...
 Given the Balance Sheet and Income Statement calculate the
follow ratios (must include calculations):
profit ratio, liquidity ratio, activity ratio, leverage ratio,
shareholder return ratio
Balance Sheet All numbers in thousands A Get access to 15+ years of historical data with Yahoo Financ Breakdown 12/31/2019 v Assets v Current Assets v Cash Cash And Cash Equivalents 2,594,000 Short Term Investments Total Cash 2,594,000 Net Receivables 25,429,000 Inventory 1,422,000 Other Current Assets Total Current Assets 37,473,000 Total Current Assets 37,473,000 Non-current...
Given the Balance Sheet and Income Statement calculate the
follow ratios (must include calculations):
profit ratio, liquidity ratio, activity ratio, leverage ratio,
shareholder return ratio
Balance Sheet All numbers in thousands A Get access to 15+ years of historical data with Yahoo Financ Breakdown 12/31/2019 v Assets v Current Assets v Cash Cash And Cash Equivalents 2,594,000 Short Term Investments Total Cash 2,594,000 Net Receivables 25,429,000 Inventory 1,422,000 Other Current Assets Total Current Assets 37,473,000 Total Current Assets 37,473,000 Non-current...
 what is the dupont EBT using avg assets equity
what is the tax burden?
INCOME STATEMENT Sales/Revenue COGS excluding D&A Depreciation & Amortization Expense Gross Income EBIT SG&A Expense Unusual Expense Interest Expense Pretax Income Income Tax - Current Domestic Consolidated Net Income 2020 19,974 11,990 1,067 6,917 5,705 104 207 901 159 691 2019 20,229 12,199 964 7,066 5,601 167 256 1,042 272 801 BALANCE SHEET Cash & Short Term Investments Total Accounts Receivable Inventories Other Current Assets Miscellaneous...
what is the dupont EBT using avg assets equity
what is the tax burden?
INCOME STATEMENT Sales/Revenue COGS excluding D&A Depreciation & Amortization Expense Gross Income EBIT SG&A Expense Unusual Expense Interest Expense Pretax Income Income Tax - Current Domestic Consolidated Net Income 2020 19,974 11,990 1,067 6,917 5,705 104 207 901 159 691 2019 20,229 12,199 964 7,066 5,601 167 256 1,042 272 801 BALANCE SHEET Cash & Short Term Investments Total Accounts Receivable Inventories Other Current Assets Miscellaneous...
Most questions answered within 3 hours.
-
Where is the error in this code sequence?
String s1 = "Hello";
String s2 = "ello";...
asked 10 months ago -
Financial data for Joel de Paris, Inc., for last year
follow:
Joel de Paris, Inc.
Balance...
asked 10 months ago -
Consider this reaction:
Al2(SO4)3 (aq)+ BaCl3
(aq) Al2Cl6 (aq)- +
3BaSO4(s) . What is the...
asked 10 months ago -
Suppose that Savneet is considering increasing her
recent random sample from 20 car rentals to 40...
asked 10 months ago -
Trucks arrive at an unloading terminal at an average rate of 120
per hour.
Trucks arrive...
asked 10 months ago -
Why are methanol and ethanol completely soluble in water while
octanol is not very little soluble....
asked 10 months ago -
A facilities manager at a university reads in a research report
that the mean amount of...
asked 10 months ago -
When the CuSO4 is rehydrated by adding water to the anhydrous
compound, is this an endothermic...
asked 10 months ago -
A ray of sunlight is passing from diamond into crown glass; the
angle of incidence is...
asked 10 months ago -
A block of mass 0.249 kg is placed on top of a light, vertical
spring of...
asked 10 months ago -
how do the kidneys compensate in the presences of acidosis
a) trigger hyperventilate
b) reserve acid...
asked 10 months ago -
Question 501 pts
The rental rate of capital to the firm increases. Which of the
following...
asked 10 months ago