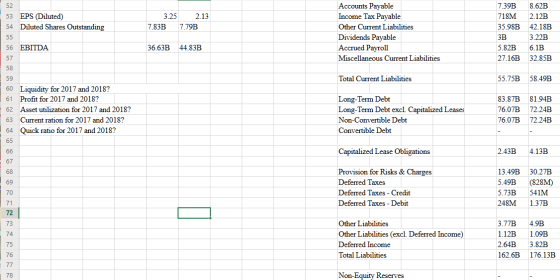
What is the asset utilization for 2017 and 2018?


Homework Answers
- Liquidity= current asset- current liability
Liquidity ratios are as follow:
|
2017(in $ B) |
2018(in $ B) |
|
|
current asset |
162.70 |
169.66 |
|
current liability |
55.75 |
58.49 |
|
liquidity= |
=162.70-55.75 = 106.95 |
= 169.66-58.49 = 111.17 |
|
current ratio=current asset/current liability |
= 162.70/55.75= 2.92 |
=169.66/58.49= 2.90 |
|
stock |
2.18 |
2.66 |
|
Quick ratio= (current asset-stock )/current liability |
=162.70-2.18/55.75 = 2.88 |
=169.66-2.66/58.49 =2.86 |
- Profit ratio:
|
Profitability: |
Formula |
2017 |
2018 |
|
EBIT margin |
EBIT/sales |
||
|
Sales |
=96.02 |
=110.18 |
|
|
EBIT= |
=61.4-32.62-0.871= 27.91 |
34.64 |
|
|
EBIT margin |
=27.91/96.02= 0.2907 or 29.07% |
=34.62/110.18= 0.3146 or 31.46% |
|
|
Net profit margin |
Net profit / sales |
=25.49/96.02= 0.2655 or 26.55% |
=16.57/110.18=0.1504or 15.04% |
- Asset management/utilization ratio:
|
Inventory Turnover ratio |
Cost of Goods sold /Average Inventory |
=34.62/2.18 = 15.88 |
=38.97/2.66= 14.65 |
|
Assume Average inventory = inventory at the end of the period |
|||
|
Days Inventory Holding |
Avg inventory/ Cost of good sold *365 |
=1/15.88 *365= 22.98 or 23 days |
= 1/14.65 *365= 24.9 or 25 days |
|
Total Asset Turnover |
Sales/ total asset |
=96.02/250.31 = 0.38 |
=110.18/258.35 = 0.43 |
|
Receivable turnover |
Sales/ receivables |
=96.02/22.43 = 4.28 |
=110.18/26.48 = 4.16 |
Add Answer to:
What is the asset utilization for 2017 and 2018?
1 Annual Financials for Microsoft Corp. 2...
Balance Sheet Assets Fiscal year is January-December. All values USD millions. 2017 Cash & Short Term...
Balance Sheet Assets Fiscal year is January-December. All values USD millions. 2017 Cash & Short Term Investments 18.3B Total Accounts Receivable 13.49B Inventories 8.77B Other Current Assets 2.54B Total Current Assets 43.09B 2017 Net Property, Plant & Equipment 17.01B Total Investments and Advances 751M Long-Term Note Receivable - Intangible Assets 85.13B Other Assets 4.22B Total Assets 157.3B Liabilities & Shareholders' Equity 2017 ST Debt & Current Portion LT Debt 3.91B Accounts Payable 7.31B Income Tax Payable 1.85B Other Current Liabilities...
What is the current ratio? (1:1) What is the debt ratio? (%) Show work please 1....
 What is the current ratio? (1:1)
What is the debt ratio? (%)
Show work please
1. What is the current ratio? (1:1) 2. What is the debt ratio? (%) *Income Statement Income StatementBalance SheetCash Flow Statement Annual Financials Annual Financials for Lowe's Cos. View Ratios Fiscal year is February January. All values USD millions 2019 Sales/Revenue 71.31B Cost of Goods Sold (COGS) incl. D&A 49.88B COGS excluding D&A 48.27B Depreciation & Amortization Expense 1.61B Depreciation 1.48B Amortization of Intangibles 130M...
What is the current ratio? (1:1)
What is the debt ratio? (%)
Show work please
1. What is the current ratio? (1:1) 2. What is the debt ratio? (%) *Income Statement Income StatementBalance SheetCash Flow Statement Annual Financials Annual Financials for Lowe's Cos. View Ratios Fiscal year is February January. All values USD millions 2019 Sales/Revenue 71.31B Cost of Goods Sold (COGS) incl. D&A 49.88B COGS excluding D&A 48.27B Depreciation & Amortization Expense 1.61B Depreciation 1.48B Amortization of Intangibles 130M...
what is the current ratio? (1:1) what is the debt ratio? (%) please show work 1....
 what is the current ratio? (1:1)
what is the debt ratio? (%)
please show work
1. What is the current ratio? (1:1) 2. What is the debt ratio? (%) *Income Statement Income Statement Balance SheetCash Flow Statement Annual Financials Quarter Financials Quarterly Financials for Lowe's Cos. View Ratios All values USD millions. 31-Oct- 2018 31-Jan- 2019 30-Apr- 2019 31-Jul- 2019 31-Oct- 2019 5-qtr trend Sales/Revenue 17.42B 15.65B 17.74B 20.99B 7.39B Cost of Goods Sold (COGS) incl. D&A 12.19B 11.12B 12.46B...
what is the current ratio? (1:1)
what is the debt ratio? (%)
please show work
1. What is the current ratio? (1:1) 2. What is the debt ratio? (%) *Income Statement Income Statement Balance SheetCash Flow Statement Annual Financials Quarter Financials Quarterly Financials for Lowe's Cos. View Ratios All values USD millions. 31-Oct- 2018 31-Jan- 2019 30-Apr- 2019 31-Jul- 2019 31-Oct- 2019 5-qtr trend Sales/Revenue 17.42B 15.65B 17.74B 20.99B 7.39B Cost of Goods Sold (COGS) incl. D&A 12.19B 11.12B 12.46B...
Income Statement Sales/Revenue Total revenue 76,480,000,000 Cost of Revenue 25,110,000,000 Gross Profit 51,370,000,000 Operating Exp 31,810,000,000...
Income Statement Sales/Revenue Total revenue 76,480,000,000 Cost of Revenue 25,110,000,000 Gross Profit 51,370,000,000 Operating Exp 31,810,000,000 Selling General & Admin - Other Operating Expense 3,390,000,000 Unusual Expense 16,180,000,000 EBIT after Unusual Expense 2,130,000,000 Non Operating Income/Expense 385,000,000 Equity in Affiliates (Pretax) 1,020,000,000 Interest Expense 17,670,000,000 Pretax Income 16,370,000,000 Other After Tax Income (Expense) 1,300,000,000 Consolidated Net Income - Minority Interest Expense 1,300,000,000 Net Income - Discontinued Operations 1,300,000,000 Net Income After Extraordinaries - Preferred Dividends 1,300,000,000 Net Income Available to...
What is the EBIT/operating profit margin for 2017 and 2018? Fiscal year is October-September. All values...
 What is the EBIT/operating profit margin for 2017 and 2018?
Fiscal year is October-September. All values USD millions 2 3 Income Statement 2017 2018 4 5 Sales/Revenue 228.57 265.81 163.83 141.7 6 Cost of Goods Sold (COGS) incl. D&A COGS excluding D&A Depreciation & Amortization Expense Depreciation Amortization of Intangibles 132.3B 154.53B 7 9.4B 9.3B 8.2B 9.3B 9 1.2B 10 86.87 11 Gross Income 101.98 12 13 SG&A Expense 26.84B 30.94B 11.58B Research & Development 14.24B 14 15 Other SG&A...
What is the EBIT/operating profit margin for 2017 and 2018?
Fiscal year is October-September. All values USD millions 2 3 Income Statement 2017 2018 4 5 Sales/Revenue 228.57 265.81 163.83 141.7 6 Cost of Goods Sold (COGS) incl. D&A COGS excluding D&A Depreciation & Amortization Expense Depreciation Amortization of Intangibles 132.3B 154.53B 7 9.4B 9.3B 8.2B 9.3B 9 1.2B 10 86.87 11 Gross Income 101.98 12 13 SG&A Expense 26.84B 30.94B 11.58B Research & Development 14.24B 14 15 Other SG&A...
Income Statement 2014 2015 2016 2017 Sales/Revenue 55.87B 55.36B 59.39B 62.76B Cost of Goods Sold (COGS)...
 Income Statement
2014
2015
2016
2017
Sales/Revenue
55.87B
55.36B
59.39B
62.76B
Cost of Goods Sold (COGS) incl. D&A
20.52B
20.65B
23.43B
23.8B
COGS excluding D&A
11.97B
11.94B
15.64B
15.68B
Depreciation & Amortization Expense
8.55B
8.71B
7.79B
8.13B
Depreciation
7.38B
7.82B
6.27B
6.75B
Amortization of Intangibles
1.17B
890M
1.52B
1.38B
Gross Income
35.35B
34.7B
35.96B
38.96B
2014
2015
2016
2017
SG&A Expense
19.69B
19.84B
21.15B
20.62B
Research & Development
11.56B
11.95B
12.75B
13.14B
Other SG&A
8.14B
7.88B
8.4B
7.48B
Other Operating...
Income Statement
2014
2015
2016
2017
Sales/Revenue
55.87B
55.36B
59.39B
62.76B
Cost of Goods Sold (COGS) incl. D&A
20.52B
20.65B
23.43B
23.8B
COGS excluding D&A
11.97B
11.94B
15.64B
15.68B
Depreciation & Amortization Expense
8.55B
8.71B
7.79B
8.13B
Depreciation
7.38B
7.82B
6.27B
6.75B
Amortization of Intangibles
1.17B
890M
1.52B
1.38B
Gross Income
35.35B
34.7B
35.96B
38.96B
2014
2015
2016
2017
SG&A Expense
19.69B
19.84B
21.15B
20.62B
Research & Development
11.56B
11.95B
12.75B
13.14B
Other SG&A
8.14B
7.88B
8.4B
7.48B
Other Operating...
February 2. January 21 2018 2017 52.643 8652 1.264 12.564 25.018 1.417 538.999 52.512 8309 1.169...
 February 2. January 21 2018 2017 52.643 8652 1.264 12.564 25.018 1.417 538.999 52.512 8309 1.169 11.990 24,658 783 (5 millions) Assets Cash and cash equivalents Inventory Other current assets Total current assets Property and equipment, net Other noncurrent assets Total assets Liabilities and shareholders' investment Accounts payable Accrued and other current lite Current portion of long term debt and notes payable Total current liabilities Long-term debit Deferred income taxes Other noncurrent liabilities Total shareholders Investment Total liabilities and shareholders'...
SMOLIRA GOLF CORP 2017 and 2018 Balance Sheets Assets Liabilities and Owners' Equity 2017 2018 2017...
 SMOLIRA GOLF CORP 2017 and 2018 Balance Sheets Assets Liabilities and Owners' Equity 2017 2018 2017 2018 Current assets Accounts Inventory Total Current liabilities $ 24,076 12,748 25,742 24,400Accounts payable 23,48427400 1,100 17,500 Cash 15,500 27,400 Notes payable Other 13,000 receivable 11,871 48,35556,000 $72,00085,616 $62,566 67,300 Total Long-term debt Owners' equity Common stock and paid-in s 45,000 45,000 224,906243,384 Accumulated retained earnings Fixed assets Net plant and equipment $269,906$288,384 $327,695 $362,700 Total $430,000 equity Total liabilities and owners'$390,261 $430,000 Total...
QUESTION 1 Given the following income statement and balance sheet data, select which items would be...
 QUESTION 1 Given the following income statement and balance sheet data, select which items would be included in presenting the cash flow from operating activities section of the statement of cash flows using the indirect method: 2019 $50,000 33,400 16,600 13,600 920 Income Statement ($ millions) Sales Less: Cost of goods sold Gross profits Less: Cash operating expenses Less: Depreciation expense Less: Amortization of intangible assets Operating profits (EBIT) Less: Interest expense Equity in earnings (loss) of affiliate Gain (loss)...
What is the company operating free cashflow for 2018 / you have the picture attached 2017 ( ASSETS 2018 () 2017 () EQUIT...
 What is the company
operating free cashflow for 2018 / you have the picture
attached
2017 ( ASSETS 2018 () 2017 () EQUITY AND LIABILITIES 2018 (E) Fixed assets Owners' equi 500,000 Common stock 1.800,000 1,700,000 448,000 Buildings ,450,000 1,200,000 Retained earnings 82,000 1.100,000 Long-term debt .200,000 Current assets Current liabilities Accounts receivable 950,000 740.000 Accounts payable 925,000 830,000 Wages payable 158,00044,000 610,000 230,000 Inventories Cash 25,000102,000 TOTAL ASSETS 3,983,000 3,314,000 TOTAL EQUITY AND LIABILITIES3,983,000 3,314,000 Income Statement 2018 ()...
What is the company
operating free cashflow for 2018 / you have the picture
attached
2017 ( ASSETS 2018 () 2017 () EQUITY AND LIABILITIES 2018 (E) Fixed assets Owners' equi 500,000 Common stock 1.800,000 1,700,000 448,000 Buildings ,450,000 1,200,000 Retained earnings 82,000 1.100,000 Long-term debt .200,000 Current assets Current liabilities Accounts receivable 950,000 740.000 Accounts payable 925,000 830,000 Wages payable 158,00044,000 610,000 230,000 Inventories Cash 25,000102,000 TOTAL ASSETS 3,983,000 3,314,000 TOTAL EQUITY AND LIABILITIES3,983,000 3,314,000 Income Statement 2018 ()...
 What is the current ratio? (1:1)
What is the debt ratio? (%)
Show work please
1. What is the current ratio? (1:1) 2. What is the debt ratio? (%) *Income Statement Income StatementBalance SheetCash Flow Statement Annual Financials Annual Financials for Lowe's Cos. View Ratios Fiscal year is February January. All values USD millions 2019 Sales/Revenue 71.31B Cost of Goods Sold (COGS) incl. D&A 49.88B COGS excluding D&A 48.27B Depreciation & Amortization Expense 1.61B Depreciation 1.48B Amortization of Intangibles 130M...
What is the current ratio? (1:1)
What is the debt ratio? (%)
Show work please
1. What is the current ratio? (1:1) 2. What is the debt ratio? (%) *Income Statement Income StatementBalance SheetCash Flow Statement Annual Financials Annual Financials for Lowe's Cos. View Ratios Fiscal year is February January. All values USD millions 2019 Sales/Revenue 71.31B Cost of Goods Sold (COGS) incl. D&A 49.88B COGS excluding D&A 48.27B Depreciation & Amortization Expense 1.61B Depreciation 1.48B Amortization of Intangibles 130M...
 what is the current ratio? (1:1)
what is the debt ratio? (%)
please show work
1. What is the current ratio? (1:1) 2. What is the debt ratio? (%) *Income Statement Income Statement Balance SheetCash Flow Statement Annual Financials Quarter Financials Quarterly Financials for Lowe's Cos. View Ratios All values USD millions. 31-Oct- 2018 31-Jan- 2019 30-Apr- 2019 31-Jul- 2019 31-Oct- 2019 5-qtr trend Sales/Revenue 17.42B 15.65B 17.74B 20.99B 7.39B Cost of Goods Sold (COGS) incl. D&A 12.19B 11.12B 12.46B...
what is the current ratio? (1:1)
what is the debt ratio? (%)
please show work
1. What is the current ratio? (1:1) 2. What is the debt ratio? (%) *Income Statement Income Statement Balance SheetCash Flow Statement Annual Financials Quarter Financials Quarterly Financials for Lowe's Cos. View Ratios All values USD millions. 31-Oct- 2018 31-Jan- 2019 30-Apr- 2019 31-Jul- 2019 31-Oct- 2019 5-qtr trend Sales/Revenue 17.42B 15.65B 17.74B 20.99B 7.39B Cost of Goods Sold (COGS) incl. D&A 12.19B 11.12B 12.46B...
 What is the EBIT/operating profit margin for 2017 and 2018?
Fiscal year is October-September. All values USD millions 2 3 Income Statement 2017 2018 4 5 Sales/Revenue 228.57 265.81 163.83 141.7 6 Cost of Goods Sold (COGS) incl. D&A COGS excluding D&A Depreciation & Amortization Expense Depreciation Amortization of Intangibles 132.3B 154.53B 7 9.4B 9.3B 8.2B 9.3B 9 1.2B 10 86.87 11 Gross Income 101.98 12 13 SG&A Expense 26.84B 30.94B 11.58B Research & Development 14.24B 14 15 Other SG&A...
What is the EBIT/operating profit margin for 2017 and 2018?
Fiscal year is October-September. All values USD millions 2 3 Income Statement 2017 2018 4 5 Sales/Revenue 228.57 265.81 163.83 141.7 6 Cost of Goods Sold (COGS) incl. D&A COGS excluding D&A Depreciation & Amortization Expense Depreciation Amortization of Intangibles 132.3B 154.53B 7 9.4B 9.3B 8.2B 9.3B 9 1.2B 10 86.87 11 Gross Income 101.98 12 13 SG&A Expense 26.84B 30.94B 11.58B Research & Development 14.24B 14 15 Other SG&A...
 Income Statement
2014
2015
2016
2017
Sales/Revenue
55.87B
55.36B
59.39B
62.76B
Cost of Goods Sold (COGS) incl. D&A
20.52B
20.65B
23.43B
23.8B
COGS excluding D&A
11.97B
11.94B
15.64B
15.68B
Depreciation & Amortization Expense
8.55B
8.71B
7.79B
8.13B
Depreciation
7.38B
7.82B
6.27B
6.75B
Amortization of Intangibles
1.17B
890M
1.52B
1.38B
Gross Income
35.35B
34.7B
35.96B
38.96B
2014
2015
2016
2017
SG&A Expense
19.69B
19.84B
21.15B
20.62B
Research & Development
11.56B
11.95B
12.75B
13.14B
Other SG&A
8.14B
7.88B
8.4B
7.48B
Other Operating...
Income Statement
2014
2015
2016
2017
Sales/Revenue
55.87B
55.36B
59.39B
62.76B
Cost of Goods Sold (COGS) incl. D&A
20.52B
20.65B
23.43B
23.8B
COGS excluding D&A
11.97B
11.94B
15.64B
15.68B
Depreciation & Amortization Expense
8.55B
8.71B
7.79B
8.13B
Depreciation
7.38B
7.82B
6.27B
6.75B
Amortization of Intangibles
1.17B
890M
1.52B
1.38B
Gross Income
35.35B
34.7B
35.96B
38.96B
2014
2015
2016
2017
SG&A Expense
19.69B
19.84B
21.15B
20.62B
Research & Development
11.56B
11.95B
12.75B
13.14B
Other SG&A
8.14B
7.88B
8.4B
7.48B
Other Operating...
 February 2. January 21 2018 2017 52.643 8652 1.264 12.564 25.018 1.417 538.999 52.512 8309 1.169 11.990 24,658 783 (5 millions) Assets Cash and cash equivalents Inventory Other current assets Total current assets Property and equipment, net Other noncurrent assets Total assets Liabilities and shareholders' investment Accounts payable Accrued and other current lite Current portion of long term debt and notes payable Total current liabilities Long-term debit Deferred income taxes Other noncurrent liabilities Total shareholders Investment Total liabilities and shareholders'...
 SMOLIRA GOLF CORP 2017 and 2018 Balance Sheets Assets Liabilities and Owners' Equity 2017 2018 2017 2018 Current assets Accounts Inventory Total Current liabilities $ 24,076 12,748 25,742 24,400Accounts payable 23,48427400 1,100 17,500 Cash 15,500 27,400 Notes payable Other 13,000 receivable 11,871 48,35556,000 $72,00085,616 $62,566 67,300 Total Long-term debt Owners' equity Common stock and paid-in s 45,000 45,000 224,906243,384 Accumulated retained earnings Fixed assets Net plant and equipment $269,906$288,384 $327,695 $362,700 Total $430,000 equity Total liabilities and owners'$390,261 $430,000 Total...
 QUESTION 1 Given the following income statement and balance sheet data, select which items would be included in presenting the cash flow from operating activities section of the statement of cash flows using the indirect method: 2019 $50,000 33,400 16,600 13,600 920 Income Statement ($ millions) Sales Less: Cost of goods sold Gross profits Less: Cash operating expenses Less: Depreciation expense Less: Amortization of intangible assets Operating profits (EBIT) Less: Interest expense Equity in earnings (loss) of affiliate Gain (loss)...
 What is the company
operating free cashflow for 2018 / you have the picture
attached
2017 ( ASSETS 2018 () 2017 () EQUITY AND LIABILITIES 2018 (E) Fixed assets Owners' equi 500,000 Common stock 1.800,000 1,700,000 448,000 Buildings ,450,000 1,200,000 Retained earnings 82,000 1.100,000 Long-term debt .200,000 Current assets Current liabilities Accounts receivable 950,000 740.000 Accounts payable 925,000 830,000 Wages payable 158,00044,000 610,000 230,000 Inventories Cash 25,000102,000 TOTAL ASSETS 3,983,000 3,314,000 TOTAL EQUITY AND LIABILITIES3,983,000 3,314,000 Income Statement 2018 ()...
What is the company
operating free cashflow for 2018 / you have the picture
attached
2017 ( ASSETS 2018 () 2017 () EQUITY AND LIABILITIES 2018 (E) Fixed assets Owners' equi 500,000 Common stock 1.800,000 1,700,000 448,000 Buildings ,450,000 1,200,000 Retained earnings 82,000 1.100,000 Long-term debt .200,000 Current assets Current liabilities Accounts receivable 950,000 740.000 Accounts payable 925,000 830,000 Wages payable 158,00044,000 610,000 230,000 Inventories Cash 25,000102,000 TOTAL ASSETS 3,983,000 3,314,000 TOTAL EQUITY AND LIABILITIES3,983,000 3,314,000 Income Statement 2018 ()...
Most questions answered within 3 hours.
-
Where is the error in this code sequence?
String s1 = "Hello";
String s2 = "ello";...
asked 10 months ago -
Financial data for Joel de Paris, Inc., for last year
follow:
Joel de Paris, Inc.
Balance...
asked 10 months ago -
Consider this reaction:
Al2(SO4)3 (aq)+ BaCl3
(aq) Al2Cl6 (aq)- +
3BaSO4(s) . What is the...
asked 10 months ago -
Suppose that Savneet is considering increasing her
recent random sample from 20 car rentals to 40...
asked 10 months ago -
Trucks arrive at an unloading terminal at an average rate of 120
per hour.
Trucks arrive...
asked 10 months ago -
Why are methanol and ethanol completely soluble in water while
octanol is not very little soluble....
asked 10 months ago -
A facilities manager at a university reads in a research report
that the mean amount of...
asked 10 months ago -
When the CuSO4 is rehydrated by adding water to the anhydrous
compound, is this an endothermic...
asked 10 months ago -
A ray of sunlight is passing from diamond into crown glass; the
angle of incidence is...
asked 10 months ago -
A block of mass 0.249 kg is placed on top of a light, vertical
spring of...
asked 10 months ago -
how do the kidneys compensate in the presences of acidosis
a) trigger hyperventilate
b) reserve acid...
asked 10 months ago -
Question 501 pts
The rental rate of capital to the firm increases. Which of the
following...
asked 10 months ago