Filename: MAE1090_HW9_2.m Write an m-file to evaluate the following complex function ?? = ?? ??+???? for...
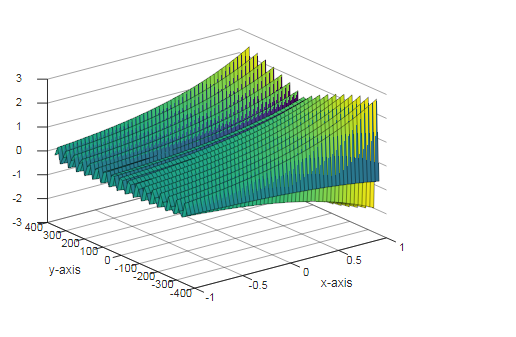
Filename: MAE1090_HW9_2.m Write an m-file to evaluate the following complex function ?? = ?? ??+???? for the interval ?1 ? ?? ? 1 and ?2?? ? ?? ? 2??. Use 50 points in both the ?? and ?? direction. Create a mesh, surface, and contour plot of the function. In each case, plot the real part of ?? versus ?? and ??. Add appropriate axis labels and titles.
Homework Answers
Code:
pi=180;
x = -1:0.0408:1; %0.0408 increment generates 50points between -1 and 1
y = -2*pi : 14.69 :2*pi;
[X,Y]= meshgrid(x,y); %meshgrid generates array of scalar vectors
z = exp(X+i*Y); %compute z
mesh(X,Y,real(z)) %plot mesh plot of real part of z
xlabel('x-axis')
ylabel('y-axis')
title('mesh plot') %gives graph title
surf(X,Y,real(z)) %plot surface plot
xlabel('x-axis')
ylabel('y-axis')
title('surface plot')
contour(X,Y,real(z)) %draw contour plot
xlabel('x-axis')
ylabel('y-axis')
title('contour plot')
output


Add Answer to:
Filename: MAE1090_HW9_2.m Write an m-file to evaluate the
following complex function ?? = ?? ??+???? for...
Create a surface plot, contour plot, and mesh plot of the function z = e^(a+jb) for...
Create a surface plot, contour plot, and mesh plot of the function z = e^(a+jb) for the interval −1 ≤ a ≤ 1 and −2π ≤ b ≤ 2π. Plot the real part of z versus a and b for each of these plots.
Problem 2: Create a surface plot and a contour plot of the function f(x, y) =...
 Problem 2: Create a surface plot and a contour plot of the function f(x, y) = xe-I(x-y2)*+y?] Where -2 x 2 and -2 < y s 2. Use a step size of 0.1. Add labels to the axis
Problem 2: Create a surface plot and a contour plot of the function f(x, y) = xe-I(x-y2)*+y?] Where -2 x 2 and -2
Problem 2: Create a surface plot and a contour plot of the function f(x, y) = xe-I(x-y2)*+y?] Where -2 x 2 and -2 < y s 2. Use a step size of 0.1. Add labels to the axis
Problem 2: Create a surface plot and a contour plot of the function f(x, y) = xe-I(x-y2)*+y?] Where -2 x 2 and -2
matlab only Question 5: a.) Write an m-file using conditional statements to evaluate the following function, assuming that the scalar variable x has a value. The function is for x <-1 - 3e y=2...
 matlab only
Question 5: a.) Write an m-file using conditional statements to evaluate the following function, assuming that the scalar variable x has a value. The function is for x <-1 - 3e y=2+cos(m) for-1 x<5 y 10-5)+1 for r 2 5 Use your file to evaluate y for x5, x-3, and x-15, and Use keyboard entry for values of x. b.) Use a for loop in the above file to plot the above function over the interval -2x <10....
matlab only
Question 5: a.) Write an m-file using conditional statements to evaluate the following function, assuming that the scalar variable x has a value. The function is for x <-1 - 3e y=2+cos(m) for-1 x<5 y 10-5)+1 for r 2 5 Use your file to evaluate y for x5, x-3, and x-15, and Use keyboard entry for values of x. b.) Use a for loop in the above file to plot the above function over the interval -2x <10....
How do I solve using Matlab? Create a matrix X so that the first row has...
 How do I solve using Matlab?
Create a matrix X so that the first row has values from 0 to 50 (default intervals), and the second row has values from 50 to 100. Let matrix Y equal to x10 and Z equal to x + y2 Create 4 subplots containing a mesh, surface, 3-Dimensional, and a surface-contour plot. Label with appropriate titles and labels. The plots should have a string look to them.
How do I solve using Matlab?
Create a matrix X so that the first row has values from 0 to 50 (default intervals), and the second row has values from 50 to 100. Let matrix Y equal to x10 and Z equal to x + y2 Create 4 subplots containing a mesh, surface, 3-Dimensional, and a surface-contour plot. Label with appropriate titles and labels. The plots should have a string look to them.
Write a function that takes, as an argument, the name of a file, fileName . Your...
Write a function that takes, as an argument, the name of a file, fileName . Your program should open (and read through) the file specified, and return the maximum value in the file. Name this function maxValueInFile(fileName). def openFile(): # Prompt for the file name filename =input("Enter a file name: " ) # Open the file for reading file = open(filename) # Prompt for the target value target =input("Enter a threshold value: ") # Initialize the counter counter = 0...
5. Write a Python function called readlinesmton that accepts the name of the file (i.e. filename),...
 5. Write a Python function called readlinesmton that accepts the name of the file (i.e. filename), starting line number i.e. m) and ending line number (i.e. n) as a parameter. The function then returns the contents from line number m to n (m <n). If m < 1 then start from line 1. Similarly, if n > number of lines the file, then stop at the last line in the file. Sample Input: readlinesmton("data.txt",5,7) Sample Input: readlinesmton("data.txt", 0,10)
MATLAB QUESTION !!! PLEASE USE MATLAB FOR BOTH QUESTIONS!!! THANKS 3) Below is a matrix of...
 MATLAB QUESTION !!! PLEASE USE MATLAB FOR BOTH
QUESTIONS!!! THANKS
3) Below is a matrix of random numbers. Find the mean, median, and mode of the matrix. B=[0 1 2 3 4 50689 23092 6 8 407] Sort Matrix Z so that the largest numbers of each row are in the first column and smallest numbers descend towards the last column. Must use sort function. 4) Create a matrix X so that the first row has values from 0 to...
MATLAB QUESTION !!! PLEASE USE MATLAB FOR BOTH
QUESTIONS!!! THANKS
3) Below is a matrix of random numbers. Find the mean, median, and mode of the matrix. B=[0 1 2 3 4 50689 23092 6 8 407] Sort Matrix Z so that the largest numbers of each row are in the first column and smallest numbers descend towards the last column. Must use sort function. 4) Create a matrix X so that the first row has values from 0 to...
python Write the function getSpamLines(filename) that read the filename text file and look for lines of the form &#...
 python
Write the function getSpamLines(filename) that read the filename text file and look for lines of the form 'SPAM-Confidence: float number'. When you encounter a line that starts with "SPAM-Confidence:" extract the floating-point number on the line. The function returns the count of the lines where the confidence value is greater than 0.8. For example, if 'spam.txt' contains the following lines along with normal text getSpamLines('spam.txt') returns 2. SPAM-Confidence: 0.8945 Mary had a little lamb. SPAM-Confidence: 0.8275 SPAM-Confidence: 0.7507 The...
python
Write the function getSpamLines(filename) that read the filename text file and look for lines of the form 'SPAM-Confidence: float number'. When you encounter a line that starts with "SPAM-Confidence:" extract the floating-point number on the line. The function returns the count of the lines where the confidence value is greater than 0.8. For example, if 'spam.txt' contains the following lines along with normal text getSpamLines('spam.txt') returns 2. SPAM-Confidence: 0.8945 Mary had a little lamb. SPAM-Confidence: 0.8275 SPAM-Confidence: 0.7507 The...
- 1 $(2) - 8.0 a) Create a function file to evaluate f(x). Write the commands...
 - 1 $(2) - 8.0 a) Create a function file to evaluate f(x). Write the commands used to create the function file. b) Obtain 5 numbers decreasing to zero. Write the commands used. c) Evaluate f(x) at the list of numbers approaching zero, write the results, and determine limo-+0+ f(x).
1) Filename: MAE1090_HW7_1.m Write an m-file that determines the maximum value in a vector, x, and...
1) Filename: MAE1090_HW7_1.m Write an m-file that determines the maximum value in a vector, x, and stores that maximum value as the variable y. Your m-file should work for both row and column vectors. For the purpose of testing and grading your m-file: DO NOT issue a clear command at the start of your m-file DO NOT define the vector x within your m-file. That vector should exist in the workspace prior to executing your m-file. Do...
 Problem 2: Create a surface plot and a contour plot of the function f(x, y) = xe-I(x-y2)*+y?] Where -2 x 2 and -2 < y s 2. Use a step size of 0.1. Add labels to the axis
Problem 2: Create a surface plot and a contour plot of the function f(x, y) = xe-I(x-y2)*+y?] Where -2 x 2 and -2
Problem 2: Create a surface plot and a contour plot of the function f(x, y) = xe-I(x-y2)*+y?] Where -2 x 2 and -2 < y s 2. Use a step size of 0.1. Add labels to the axis
Problem 2: Create a surface plot and a contour plot of the function f(x, y) = xe-I(x-y2)*+y?] Where -2 x 2 and -2
 matlab only
Question 5: a.) Write an m-file using conditional statements to evaluate the following function, assuming that the scalar variable x has a value. The function is for x <-1 - 3e y=2+cos(m) for-1 x<5 y 10-5)+1 for r 2 5 Use your file to evaluate y for x5, x-3, and x-15, and Use keyboard entry for values of x. b.) Use a for loop in the above file to plot the above function over the interval -2x <10....
matlab only
Question 5: a.) Write an m-file using conditional statements to evaluate the following function, assuming that the scalar variable x has a value. The function is for x <-1 - 3e y=2+cos(m) for-1 x<5 y 10-5)+1 for r 2 5 Use your file to evaluate y for x5, x-3, and x-15, and Use keyboard entry for values of x. b.) Use a for loop in the above file to plot the above function over the interval -2x <10....
 How do I solve using Matlab?
Create a matrix X so that the first row has values from 0 to 50 (default intervals), and the second row has values from 50 to 100. Let matrix Y equal to x10 and Z equal to x + y2 Create 4 subplots containing a mesh, surface, 3-Dimensional, and a surface-contour plot. Label with appropriate titles and labels. The plots should have a string look to them.
How do I solve using Matlab?
Create a matrix X so that the first row has values from 0 to 50 (default intervals), and the second row has values from 50 to 100. Let matrix Y equal to x10 and Z equal to x + y2 Create 4 subplots containing a mesh, surface, 3-Dimensional, and a surface-contour plot. Label with appropriate titles and labels. The plots should have a string look to them.
 5. Write a Python function called readlinesmton that accepts the name of the file (i.e. filename), starting line number i.e. m) and ending line number (i.e. n) as a parameter. The function then returns the contents from line number m to n (m <n). If m < 1 then start from line 1. Similarly, if n > number of lines the file, then stop at the last line in the file. Sample Input: readlinesmton("data.txt",5,7) Sample Input: readlinesmton("data.txt", 0,10)
 MATLAB QUESTION !!! PLEASE USE MATLAB FOR BOTH
QUESTIONS!!! THANKS
3) Below is a matrix of random numbers. Find the mean, median, and mode of the matrix. B=[0 1 2 3 4 50689 23092 6 8 407] Sort Matrix Z so that the largest numbers of each row are in the first column and smallest numbers descend towards the last column. Must use sort function. 4) Create a matrix X so that the first row has values from 0 to...
MATLAB QUESTION !!! PLEASE USE MATLAB FOR BOTH
QUESTIONS!!! THANKS
3) Below is a matrix of random numbers. Find the mean, median, and mode of the matrix. B=[0 1 2 3 4 50689 23092 6 8 407] Sort Matrix Z so that the largest numbers of each row are in the first column and smallest numbers descend towards the last column. Must use sort function. 4) Create a matrix X so that the first row has values from 0 to...
 python
Write the function getSpamLines(filename) that read the filename text file and look for lines of the form 'SPAM-Confidence: float number'. When you encounter a line that starts with "SPAM-Confidence:" extract the floating-point number on the line. The function returns the count of the lines where the confidence value is greater than 0.8. For example, if 'spam.txt' contains the following lines along with normal text getSpamLines('spam.txt') returns 2. SPAM-Confidence: 0.8945 Mary had a little lamb. SPAM-Confidence: 0.8275 SPAM-Confidence: 0.7507 The...
python
Write the function getSpamLines(filename) that read the filename text file and look for lines of the form 'SPAM-Confidence: float number'. When you encounter a line that starts with "SPAM-Confidence:" extract the floating-point number on the line. The function returns the count of the lines where the confidence value is greater than 0.8. For example, if 'spam.txt' contains the following lines along with normal text getSpamLines('spam.txt') returns 2. SPAM-Confidence: 0.8945 Mary had a little lamb. SPAM-Confidence: 0.8275 SPAM-Confidence: 0.7507 The...
 - 1 $(2) - 8.0 a) Create a function file to evaluate f(x). Write the commands used to create the function file. b) Obtain 5 numbers decreasing to zero. Write the commands used. c) Evaluate f(x) at the list of numbers approaching zero, write the results, and determine limo-+0+ f(x).
Most questions answered within 3 hours.
-
Where is the error in this code sequence?
String s1 = "Hello";
String s2 = "ello";...
asked 10 months ago -
Financial data for Joel de Paris, Inc., for last year
follow:
Joel de Paris, Inc.
Balance...
asked 10 months ago -
Consider this reaction:
Al2(SO4)3 (aq)+ BaCl3
(aq) Al2Cl6 (aq)- +
3BaSO4(s) . What is the...
asked 10 months ago -
Suppose that Savneet is considering increasing her
recent random sample from 20 car rentals to 40...
asked 10 months ago -
Trucks arrive at an unloading terminal at an average rate of 120
per hour.
Trucks arrive...
asked 10 months ago -
Why are methanol and ethanol completely soluble in water while
octanol is not very little soluble....
asked 10 months ago -
A facilities manager at a university reads in a research report
that the mean amount of...
asked 10 months ago -
When the CuSO4 is rehydrated by adding water to the anhydrous
compound, is this an endothermic...
asked 10 months ago -
A ray of sunlight is passing from diamond into crown glass; the
angle of incidence is...
asked 10 months ago -
A block of mass 0.249 kg is placed on top of a light, vertical
spring of...
asked 10 months ago -
how do the kidneys compensate in the presences of acidosis
a) trigger hyperventilate
b) reserve acid...
asked 10 months ago -
Question 501 pts
The rental rate of capital to the firm increases. Which of the
following...
asked 10 months ago