
Homework Answers
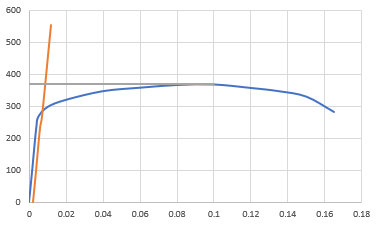
The following images provide the data points required to plot
the graph. The stress is calculated by using the Load divided with
the crossectional area. Similarly, Strain is calculated by a change
in length per original length. Therefore Stress-Strain Curve is
plotted using the same. An offset of 0.2% is plotted in the graph
which is used to calculate 0.2% offset yield strength. Tensile
Strength is the Maximum Strength under Stress-Strain Curve. Young's
Modulus is the Slope of Longitudinal Stress by corresponding
Strain. Ductility in terms of % change in length and % change in
the area is also calculated.


Add Answer to:
2. (70 pts) A cylindrical specimen of an alloy having a diameter of 12.8 mm and...
5. A cylindrical specimen of aluminum having a diameter of 12.8 mm and a gauge length...
 5. A cylindrical specimen of aluminum having a diameter of 12.8 mm and a gauge length of 50.800 mm is pulled in tension. Use the load-elongation characteristics tabulated below to complete parts (a) through (f). Use SI unit system. Load Length 0 7330 15,100 23,100 30,400 34,400 38,400 41,300 44,800 46,200 47,300 47,500 46,100 44,800 42,600 36,400 lb 0 1650 3,400 5,200 6,850 7,750 8,650 9,300 10,100 10,400 10,650 10,700 10,400 10,100 9,600 mim 50.800 50.851 50.902 50.952 51.003 51.054...
It is desired to evaluate the tensile properties of an aluminum alloy. A tensile test is...
It is desired to evaluate the tensile properties of an aluminum alloy. A tensile test is performed using a standard cylindrical tensile specimen with a diameter of 12.8 mm and a gauge length of 50.800 mm. The gage length and final diameter of the sample are measured after the sample is removed from the testing machine. The gage length and the diameter of the necked region after the specimen was removed from the testing machine are 60 mm and 9...
The following data was collected from a standard 12.827 mm diameter tensile test specimen of a...
The following data was collected from a standard 12.827 mm diameter tensile test specimen of a copper alloy with a gauge length of 50. 80mm. An initial cross head speed of 8.5mm/minute was used. After fracture, the gauge length was 76.556mm and the diameter was 9.5mm. Load (kN) Gauge Length (mm) 0 50.8 13.44 50.842 26.88 50.885 33.60 50.906 40.32 51.029 47.04 51.816 53.76 57.404 55.55 63.500 51.07 (fracture) 76.708 Use the given data to plot a graph and: (a)...
(c) Acylindrical specimen of stainless steel having a diameter of 12.8 mm and a gauge length...
 (c) Acylindrical specimen of stainless steel having a diameter of 12.8 mm and a gauge length of 50.800 mm is pulled in tension. The data acquired was used to plot engineering stress versus engineering strain as shown in the following two graphs (please note that fig. b is a blown-up clastic portion of (a)). Use the o-curves to complete parts through (vi) Stress (MP) 0.00 0.02 0.04 0.06 0.08 0.10 Strain Fig (a). - curve of stainless steel Stress (MPa)...
A Grade 2 Titanium tension test specimen has a diameter of 12.60 mm and a gage...
 A Grade 2 Titanium tension test specimen has a diameter of 12.60 mm and a gage length of 50 mm. In a test to fracture, load and deformation data obtained during the test are given in the accompanying table. Plot the stress strain relationship then, determine the following: (a) the modulus of elasticity. (b) the proportional limit. (c) the yield strength (0.20% offset). (d) the ultimate strength. (e) the fracture stress. (f) the true fracture stress if the final diameter...
A cylindrical specimen of a metal alloy 47.9 mm long and 9.72 mm in diameter is...
A cylindrical specimen of a metal alloy 47.9 mm long and 9.72 mm in diameter is stressed in tension. A true stress of 379 MPa causes the specimen to plastically elongate to a length of 52.5 mm. If it is known that the strain-hardening exponent for this alloy is 0.2, calculate the true stress (in MPa) necessary to plastically elongate a specimen of this same material from a length of 47.9 mm to a length of 57.6 mm.
A cylindrical specimen of a metal alloy 47.8 mm long and 9.72 mm in diameter is...
A cylindrical specimen of a metal alloy 47.8 mm long and 9.72 mm in diameter is stressed in tension. A true stress of 399 MPa causes the specimen to plastically elongate to a length of 51.9 mm. If it is known that the strain-hardening exponent for this alloy is 0.3, calculate the true stress (in MPa) necessary to plastically elongate a specimen of this same material from a length of 47.8 mm to a length of 57.4 mm.
The following data was collected from a standard 12.827 mm diameter tensile test specimen of a...
The following data was collected from a standard 12.827 mm diameter tensile test specimen of a copper alloy with a gauge length of 50. 80mm. An initial cross head speed of 8.5mm/minute was used. After fracture, the gauge length was 76.556mm and the diameter was 9.5mm. Load (kN) Gauge Length (mm) 0 50.8 13.44 50.842 26.88 50.885 33.60 50.906 40.32 51.029 47.04 51.816 53.76 57.404 55.55 63.500 51.07 (fracture) 76.708 Use the given data to plot a graph and: (a)...
1.6 points) A tensile test specimen having a diameter of 10 mm and a gange length...
 1.6 points) A tensile test specimen having a diameter of 10 mm and a gange length of 50 mm wa. tested to fracture. The stress-strain curve from the tension test is shown below. Labeling your points and showing the necessary steps, along with the corresponding calculations, find the following magnitudes: (a) Modulus of Elasticity, E = (b) Ultimate Strength = (e) Yield stress (0.2% offset method), (d) If the shear modulus of elasticity of the material is 28 GPa, determine...
 5. A cylindrical specimen of aluminum having a diameter of 12.8 mm and a gauge length of 50.800 mm is pulled in tension. Use the load-elongation characteristics tabulated below to complete parts (a) through (f). Use SI unit system. Load Length 0 7330 15,100 23,100 30,400 34,400 38,400 41,300 44,800 46,200 47,300 47,500 46,100 44,800 42,600 36,400 lb 0 1650 3,400 5,200 6,850 7,750 8,650 9,300 10,100 10,400 10,650 10,700 10,400 10,100 9,600 mim 50.800 50.851 50.902 50.952 51.003 51.054...
 (c) Acylindrical specimen of stainless steel having a diameter of 12.8 mm and a gauge length of 50.800 mm is pulled in tension. The data acquired was used to plot engineering stress versus engineering strain as shown in the following two graphs (please note that fig. b is a blown-up clastic portion of (a)). Use the o-curves to complete parts through (vi) Stress (MP) 0.00 0.02 0.04 0.06 0.08 0.10 Strain Fig (a). - curve of stainless steel Stress (MPa)...
 A Grade 2 Titanium tension test specimen has a diameter of 12.60 mm and a gage length of 50 mm. In a test to fracture, load and deformation data obtained during the test are given in the accompanying table. Plot the stress strain relationship then, determine the following: (a) the modulus of elasticity. (b) the proportional limit. (c) the yield strength (0.20% offset). (d) the ultimate strength. (e) the fracture stress. (f) the true fracture stress if the final diameter...
 1.6 points) A tensile test specimen having a diameter of 10 mm and a gange length of 50 mm wa. tested to fracture. The stress-strain curve from the tension test is shown below. Labeling your points and showing the necessary steps, along with the corresponding calculations, find the following magnitudes: (a) Modulus of Elasticity, E = (b) Ultimate Strength = (e) Yield stress (0.2% offset method), (d) If the shear modulus of elasticity of the material is 28 GPa, determine...
Most questions answered within 3 hours.
-
Where is the error in this code sequence?
String s1 = "Hello";
String s2 = "ello";...
asked 11 months ago -
Financial data for Joel de Paris, Inc., for last year
follow:
Joel de Paris, Inc.
Balance...
asked 11 months ago -
Consider this reaction:
Al2(SO4)3 (aq)+ BaCl3
(aq) Al2Cl6 (aq)- +
3BaSO4(s) . What is the...
asked 11 months ago -
Suppose that Savneet is considering increasing her
recent random sample from 20 car rentals to 40...
asked 11 months ago -
Trucks arrive at an unloading terminal at an average rate of 120
per hour.
Trucks arrive...
asked 11 months ago -
Why are methanol and ethanol completely soluble in water while
octanol is not very little soluble....
asked 11 months ago -
A facilities manager at a university reads in a research report
that the mean amount of...
asked 11 months ago -
When the CuSO4 is rehydrated by adding water to the anhydrous
compound, is this an endothermic...
asked 11 months ago -
A ray of sunlight is passing from diamond into crown glass; the
angle of incidence is...
asked 11 months ago -
A block of mass 0.249 kg is placed on top of a light, vertical
spring of...
asked 11 months ago -
how do the kidneys compensate in the presences of acidosis
a) trigger hyperventilate
b) reserve acid...
asked 11 months ago -
Question 501 pts
The rental rate of capital to the firm increases. Which of the
following...
asked 11 months ago