Please complete A-B showing all work
Homework Answers


Add Answer to:
Please complete A-B showing all work
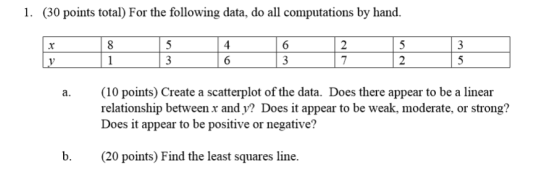
1. (30 points total) For the following data, do all...
A set of bivariate data consists of these measurements on two variables, x and y: 2...
 A set of bivariate data consists of these measurements on two variables, x and y: 2 4 4 6 8 4 7 6 (a) Make a scatterplot. Comment on the form, direction, and strength of the relationship. The relationship appears to be linear, positive, and fairly weak. The relationship appears to be linear, negative, and fairly strong. The relationship appears to be linear, positive, and fairly strong. The relationship appears to be linear, negative, and fairly weak. ● The relationship...
Data on pollution and cost of medical care for elderly people are shown here. The following...
 Data on pollution and cost of medical care for elderly people are shown here. The following data give a measure of pollution (micrograms of particulate matter per cubic meter of air) and the cost of medical care per person over age 65 for six geographic regions of the United States Cost of Medical Region North Upper South 31.8 Deep South 32.1 West South Big Sky West Pollution Care 924 900 977 981 961 908 30.0 26.8 30.4 40.0 The equation...
(4 points) Residuals vs fitted plots can be used to assess whether the four key assumptions for a...
(4 points) Residuals vs fitted plots can be used to assess whether the four key assumptions for a simple linear regression have been met. Each of the plots below displays an instance where at least one of these assumptions may not have been met. For each plot, identify which assumption has been most violated, if any. 1. Plot A shows that A. The relationship between x and y cannot be assumed to be linear. B. The residuals do not appear...
Homework 4 Use the hand span data that we collected in class for homework Suppose you...
Homework 4 Use the hand span data that we collected in class for homework Suppose you want to buy someone a pair of love, but you do not know their love size. Usually, we do have a pretty good idea of the person's height. Let' asume that the right hand span is a rood indicator of the love size. So let find the best predictor of right hand span be on the person's height. Once we can predict the right...
9. In a small town in Ohio, a real estate broker recorded the size of ten...
 9. In a small town in Ohio, a real estate broker recorded the size of ten houses, in square feet. and the selling price of each house. She plotted the data in the scatterplot shown below. 400,000 350,000+ 300,000+ Selling Price (5) 250,000+ 200,000 150,000+ 100,000+ 0 500 1000 1500 2000 2500 3000 3500 Size (Square Feet) Select the best description of the relationship between the size and the selling price for these houses. a. There does not appear to...
Consider this set of bivariate data. y| 5.6 4.7 4.6 3.7 3.4 2.6 (a) Draw a...
 Consider this set of bivariate data. y| 5.6 4.7 4.6 3.7 3.4 2.6 (a) Draw a scatterplot to describe the data Flash Player version 10 or higher is required for this question. You can get Flash Player free from Adobe's website. (b) Does there appear to be a relationship between x and y? If so, how do you describe it? O Yes, there appears to be a positive relationship between x and y. As x increases, y increases. O Yes,...
For the following data (a) display the data in a scatter plot, (b) calculate the sample...
For the following data (a) display the data in a scatter plot, (b) calculate the sample correlation coefficient r, and (c) make a conclusion about the type of correlation. Use technology. The earnings per share (in dollars) and the dividends per share (in dollars) for 66 medical supplies companies in a recent year are shown in the data set below. Earnings per share, x 2.74 5.02 4.57 3.05 3.77 2.17 + + + Dividends per share, y 0.54 2.37 1.44...
setup a predictive equation involving variable 1 and variable 2. First, you plot the data below...
setup a predictive equation involving variable 1 and variable 2. First, you plot the data below to determine if linear regression applies. variable1 -0.21582 0.56997 -0.54850 -0.12385 0.06975 0.16327 -0.72595 0.22500 -0.40463 0.67652 -0.82322 0.06747 0.74055 -0.71577 -0.82231 -0.47603 0.58094 -0.58573 0.19003 -0.49528 0.93083 0.61389 -0.91742 -0.60957 variable2 0.89369 -0.72620 -0.09185 0.50086 -0.73607 0.88498 -0.27512 0.62647 0.92432 0.56368 0.73005 -0.74824 0.79412 -0.04509 -0.70951 0.01573 0.51169 0.10376 -0.90089 0.04767 -0.16886 -0.65529 0.25296 -0.24747 Choose your answer from the following: a) The...
Please check if my work is right. If it isn't please fix it or add to...
 Please check if my work is
right. If it isn't please fix it or add to it. Or you can just
ignore my answers and give your answers. Thank you.
1. Researchers studying a pack of gray wolves in North America collected data on the length x, in meters, from in kilograms, of the wolves. A scatterplot of weight versus length revealed nose to tip of tail, and the w a relationship between the twov aş positive, linear, and strong....
Please check if my work is
right. If it isn't please fix it or add to it. Or you can just
ignore my answers and give your answers. Thank you.
1. Researchers studying a pack of gray wolves in North America collected data on the length x, in meters, from in kilograms, of the wolves. A scatterplot of weight versus length revealed nose to tip of tail, and the w a relationship between the twov aş positive, linear, and strong....
The following information regarding a dependent variable (Y in $1000) and an independent variable (X) is...
 The following information
regarding a dependent variable (Y in $1000) and an independent
variable (X) is provided.
Y
Dependent Variable
15
17
23
17
I. The least-squares estimate of the slope
equals:
II. The least-squares estimate of the intercept
equals:
III. If the independent variable increases by 2
units, the dependent variable is expected to
a. decrease by $300
b. decrease by $3000
c. decrease by $3
d. decrease by $2
e. none of the above
The letter corresponding...
The following information
regarding a dependent variable (Y in $1000) and an independent
variable (X) is provided.
Y
Dependent Variable
15
17
23
17
I. The least-squares estimate of the slope
equals:
II. The least-squares estimate of the intercept
equals:
III. If the independent variable increases by 2
units, the dependent variable is expected to
a. decrease by $300
b. decrease by $3000
c. decrease by $3
d. decrease by $2
e. none of the above
The letter corresponding...
 A set of bivariate data consists of these measurements on two variables, x and y: 2 4 4 6 8 4 7 6 (a) Make a scatterplot. Comment on the form, direction, and strength of the relationship. The relationship appears to be linear, positive, and fairly weak. The relationship appears to be linear, negative, and fairly strong. The relationship appears to be linear, positive, and fairly strong. The relationship appears to be linear, negative, and fairly weak. ● The relationship...
 Data on pollution and cost of medical care for elderly people are shown here. The following data give a measure of pollution (micrograms of particulate matter per cubic meter of air) and the cost of medical care per person over age 65 for six geographic regions of the United States Cost of Medical Region North Upper South 31.8 Deep South 32.1 West South Big Sky West Pollution Care 924 900 977 981 961 908 30.0 26.8 30.4 40.0 The equation...
 9. In a small town in Ohio, a real estate broker recorded the size of ten houses, in square feet. and the selling price of each house. She plotted the data in the scatterplot shown below. 400,000 350,000+ 300,000+ Selling Price (5) 250,000+ 200,000 150,000+ 100,000+ 0 500 1000 1500 2000 2500 3000 3500 Size (Square Feet) Select the best description of the relationship between the size and the selling price for these houses. a. There does not appear to...
 Consider this set of bivariate data. y| 5.6 4.7 4.6 3.7 3.4 2.6 (a) Draw a scatterplot to describe the data Flash Player version 10 or higher is required for this question. You can get Flash Player free from Adobe's website. (b) Does there appear to be a relationship between x and y? If so, how do you describe it? O Yes, there appears to be a positive relationship between x and y. As x increases, y increases. O Yes,...
 Please check if my work is
right. If it isn't please fix it or add to it. Or you can just
ignore my answers and give your answers. Thank you.
1. Researchers studying a pack of gray wolves in North America collected data on the length x, in meters, from in kilograms, of the wolves. A scatterplot of weight versus length revealed nose to tip of tail, and the w a relationship between the twov aş positive, linear, and strong....
Please check if my work is
right. If it isn't please fix it or add to it. Or you can just
ignore my answers and give your answers. Thank you.
1. Researchers studying a pack of gray wolves in North America collected data on the length x, in meters, from in kilograms, of the wolves. A scatterplot of weight versus length revealed nose to tip of tail, and the w a relationship between the twov aş positive, linear, and strong....
 The following information
regarding a dependent variable (Y in $1000) and an independent
variable (X) is provided.
Y
Dependent Variable
15
17
23
17
I. The least-squares estimate of the slope
equals:
II. The least-squares estimate of the intercept
equals:
III. If the independent variable increases by 2
units, the dependent variable is expected to
a. decrease by $300
b. decrease by $3000
c. decrease by $3
d. decrease by $2
e. none of the above
The letter corresponding...
The following information
regarding a dependent variable (Y in $1000) and an independent
variable (X) is provided.
Y
Dependent Variable
15
17
23
17
I. The least-squares estimate of the slope
equals:
II. The least-squares estimate of the intercept
equals:
III. If the independent variable increases by 2
units, the dependent variable is expected to
a. decrease by $300
b. decrease by $3000
c. decrease by $3
d. decrease by $2
e. none of the above
The letter corresponding...
Most questions answered within 3 hours.
-
Where is the error in this code sequence?
String s1 = "Hello";
String s2 = "ello";...
asked 10 months ago -
Financial data for Joel de Paris, Inc., for last year
follow:
Joel de Paris, Inc.
Balance...
asked 10 months ago -
Consider this reaction:
Al2(SO4)3 (aq)+ BaCl3
(aq) Al2Cl6 (aq)- +
3BaSO4(s) . What is the...
asked 10 months ago -
Suppose that Savneet is considering increasing her
recent random sample from 20 car rentals to 40...
asked 10 months ago -
Trucks arrive at an unloading terminal at an average rate of 120
per hour.
Trucks arrive...
asked 10 months ago -
Why are methanol and ethanol completely soluble in water while
octanol is not very little soluble....
asked 10 months ago -
A facilities manager at a university reads in a research report
that the mean amount of...
asked 10 months ago -
When the CuSO4 is rehydrated by adding water to the anhydrous
compound, is this an endothermic...
asked 10 months ago -
A ray of sunlight is passing from diamond into crown glass; the
angle of incidence is...
asked 10 months ago -
A block of mass 0.249 kg is placed on top of a light, vertical
spring of...
asked 10 months ago -
how do the kidneys compensate in the presences of acidosis
a) trigger hyperventilate
b) reserve acid...
asked 10 months ago -
Question 501 pts
The rental rate of capital to the firm increases. Which of the
following...
asked 10 months ago