Show Matlab plot comparasion properly please
Homework Answers
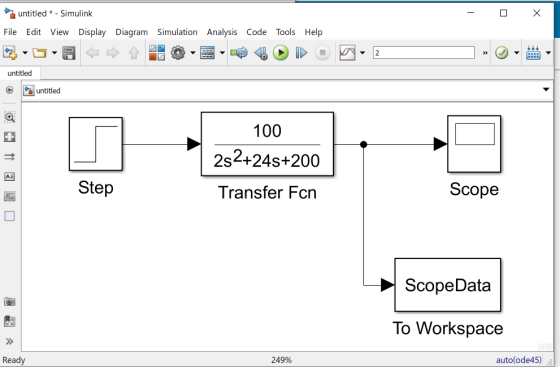
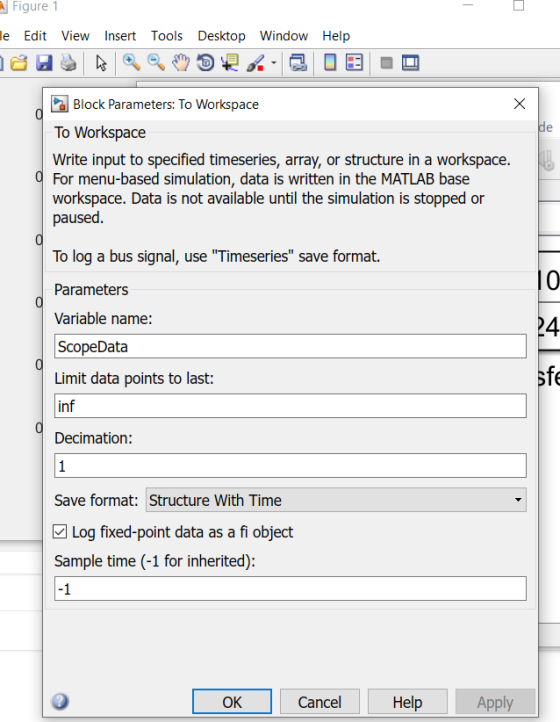
Using SIMULINK
:
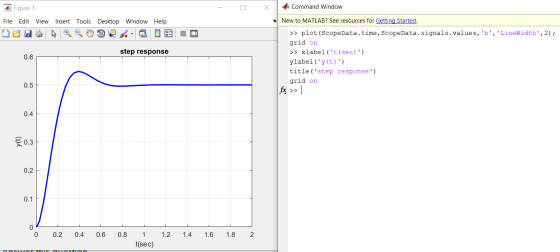
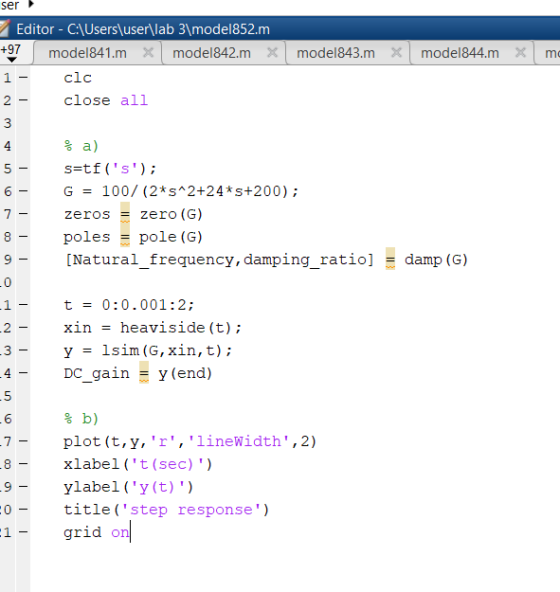
using MATLAB code :
Add Answer to:
Show Matlab plot comparasion properly please
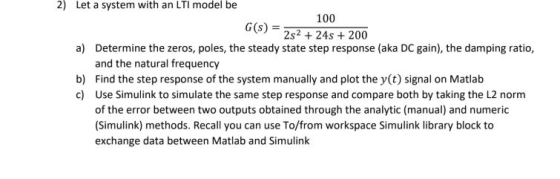
2) Let a system with an LTI model be 100...
2) Let a system with an LTI model be 100 G(s) 2s2 + 24s + 200...
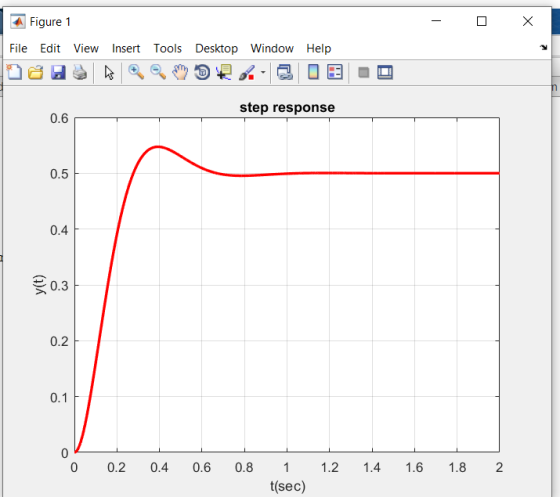
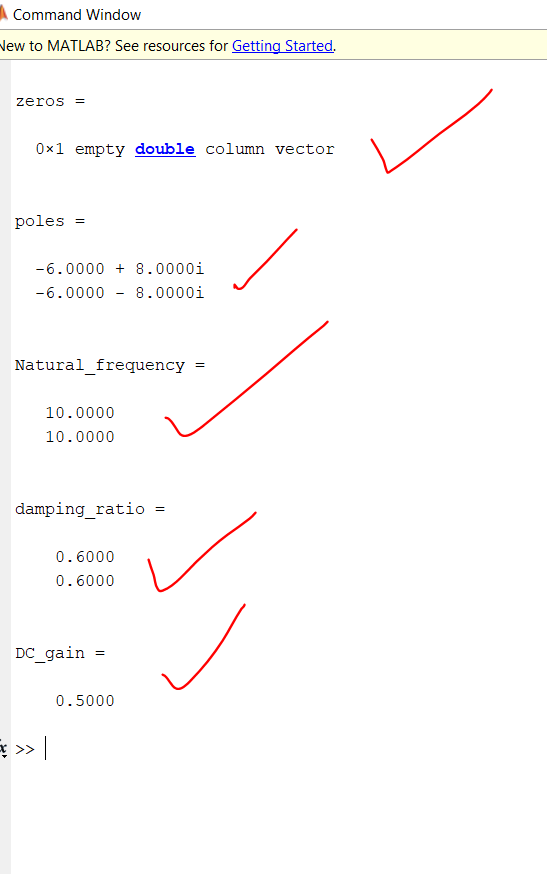
 2) Let a system with an LTI model be 100 G(s) 2s2 + 24s + 200 a) Determine the zeros, poles, the steady state step response (aka DC gain), the damping ratio, and the natural frequency b) Find the step response of the system manually and plot the y(t) signal on Matlab c) Use Simulink to simulate the same step response and compare both by taking the L2 norm of the error between two outputs obtained through the analytic (manual)...
Can you Solve in matlab please. I need your help B-7-6. Consider the system shown in Figure 7-59. Plot the root loci for the system. Determine the value of K such that the damping ratio ζ of the d...
 Can you Solve in matlab please. I need your help
B-7-6. Consider the system shown in Figure 7-59. Plot the root loci for the system. Determine the value of K such that the damping ratio ζ of the dominant closed-loop poles is 05. Then determine all closed-loop poles. Plot the unit-step response curve with MATLAB. s(s2 +4s +5) Figure 7-59 Control system.
B-7-6. Consider the system shown in Figure 7-59. Plot the root loci for the system. Determine the value...
Can you Solve in matlab please. I need your help
B-7-6. Consider the system shown in Figure 7-59. Plot the root loci for the system. Determine the value of K such that the damping ratio ζ of the dominant closed-loop poles is 05. Then determine all closed-loop poles. Plot the unit-step response curve with MATLAB. s(s2 +4s +5) Figure 7-59 Control system.
B-7-6. Consider the system shown in Figure 7-59. Plot the root loci for the system. Determine the value...
100 Consider the following LTI system, 5, and wo = 2000π rad/sec. where, Q a) Use MATLAB to deter...
 please complete this project.
100 Consider the following LTI system, 5, and wo = 2000π rad/sec. where, Q a) Use MATLAB to determine magnitude response and phase response of the filter b) What type of filter is it? c) What will be the output of this filter if input x,(t)-5Cos(100t). Show all calculations step by step as shown in Lecture-20 d) Verify your answer of part (e) by using Simulink model. Attach the snapshot of Simulink model and output e)...
please complete this project.
100 Consider the following LTI system, 5, and wo = 2000π rad/sec. where, Q a) Use MATLAB to determine magnitude response and phase response of the filter b) What type of filter is it? c) What will be the output of this filter if input x,(t)-5Cos(100t). Show all calculations step by step as shown in Lecture-20 d) Verify your answer of part (e) by using Simulink model. Attach the snapshot of Simulink model and output e)...
Clear steps, please. Consider the following LTI system where, Q -5, and w 2000m rad./sec. a)...
 Clear steps, please.
Consider the following LTI system where, Q -5, and w 2000m rad./sec. a) Use MATLAB to determine magnitude response and phase response of the filter. b) What type of filter is it? c) What will be the output of this filter if input xio- 5Cos(1000). Show all calculations step by step as shown in Lecture-21 . d) Verify your answer of part (e) by using Simulink model. Attach the snapshot of Simulink model and output. e) What...
Clear steps, please.
Consider the following LTI system where, Q -5, and w 2000m rad./sec. a) Use MATLAB to determine magnitude response and phase response of the filter. b) What type of filter is it? c) What will be the output of this filter if input xio- 5Cos(1000). Show all calculations step by step as shown in Lecture-21 . d) Verify your answer of part (e) by using Simulink model. Attach the snapshot of Simulink model and output. e) What...
Q4. 1 2 3 G 10 pts. Use MATLAB and plot the step response of the following systems G3 2s+1 figure. Gy on the same 2s+1...
 Q4. 1 2 3 G 10 pts. Use MATLAB and plot the step response of the following systems G3 2s+1 figure. Gy on the same 2s+1 2s+1 Explain the similarities (at least 1) and differences (at least 1) between these responses. E_ figure. G, G 3 10 pts. Use MATLAB and plot the impulse response of the following systems Explain the similarities and differences between these responses. on the same 25+1 10 pts. Find the time constant (Te), pole(s), DC...
control system System Description: The figure 1 and 2 below show, respectively, components and block diagram...
 control system
System Description: The figure 1 and 2 below show, respectively, components and block diagram of a motor and the measurements of velocity (via the tacho unit) and position (via the potentiometer). n represents the gearbox ratio between the rotating shaft and the output shaft. The left-hand side of the diagram represents the controller. A reference set point for the rotating shaft is entered in degrees and this is equivalent voltage. The error is calculated by subtracting the measured...
control system
System Description: The figure 1 and 2 below show, respectively, components and block diagram of a motor and the measurements of velocity (via the tacho unit) and position (via the potentiometer). n represents the gearbox ratio between the rotating shaft and the output shaft. The left-hand side of the diagram represents the controller. A reference set point for the rotating shaft is entered in degrees and this is equivalent voltage. The error is calculated by subtracting the measured...
Please solve it with step by step MATLAB code, thank you! Suppose that a system is shown in Figure 2. Based on for loop, write a piece of MATLAB code to calculate the closed loop poles for 03K35 and...
 Please solve it with step by step MATLAB code, thank you!
Suppose that a system is shown in Figure 2. Based on for loop, write a piece of MATLAB code to calculate the closed loop poles for 03K35 and plot the outputs where the poles are represented by "W" letter. Find the interval of K parameter for stability using Routh-Hurwitz method. Calculate the poles of the closed loop transfer function where K attains the minimum value such that the system...
Please solve it with step by step MATLAB code, thank you!
Suppose that a system is shown in Figure 2. Based on for loop, write a piece of MATLAB code to calculate the closed loop poles for 03K35 and plot the outputs where the poles are represented by "W" letter. Find the interval of K parameter for stability using Routh-Hurwitz method. Calculate the poles of the closed loop transfer function where K attains the minimum value such that the system...
please show work thank you! Use Matlab to and the SISOTool construct the system for analysis...
 please show work
thank you!
Use Matlab to and the SISOTool construct the system for analysis (You may want to preview the tf and sisotool commands from matlab by typing help tf or doc tf etc...) Each Block B1, B2, B3 and B4 will be constructed individually and then concatenated together As shown in the block diagram let K=0.1 Set B1 = 0.1 by typing in matlab >>B1=0.1 To assign the Blockl values use the TF command to construct a...
please show work
thank you!
Use Matlab to and the SISOTool construct the system for analysis (You may want to preview the tf and sisotool commands from matlab by typing help tf or doc tf etc...) Each Block B1, B2, B3 and B4 will be constructed individually and then concatenated together As shown in the block diagram let K=0.1 Set B1 = 0.1 by typing in matlab >>B1=0.1 To assign the Blockl values use the TF command to construct a...
3. Consider a second order system with transfer fuction P(s) = 2-B2 with a = 4000...
 3. Consider a second order system with transfer fuction P(s) = 2-B2 with a = 4000 and ß = 25. Design a compensator assuming unity feedback for the gain and phase margins you apriori specify (try to achieve as high as possible). Compute the poles and zeros of the closed-loor system. Plot the Nyquist plot of your compensator and verify that the Nyquist criterion is satisfied. Plot the step response of the closed-loop system and specify maximum overshoot, peak time,...
Problem 2 Wis) R(s) U(s) Gol (s) D a (s) E(s) H(s) Given a system as in the diagram above, use MATLAB to solve the problems: Assume we want the closed-loop system rise time to be t, 0.18 sec S + Z H(...
 Problem 2 Wis) R(s) U(s) Gol (s) D a (s) E(s) H(s) Given a system as in the diagram above, use MATLAB to solve the problems: Assume we want the closed-loop system rise time to be t, 0.18 sec S + Z H(s) 1 Gpl)s(s+)et s(s 1) s + p a) Assume W(s)-0. Draw the root locus of the system assuming compensator consists only of the adjustable gain parameter K, i.e. Dct (s) Determine the approximate range of values of...
 2) Let a system with an LTI model be 100 G(s) 2s2 + 24s + 200 a) Determine the zeros, poles, the steady state step response (aka DC gain), the damping ratio, and the natural frequency b) Find the step response of the system manually and plot the y(t) signal on Matlab c) Use Simulink to simulate the same step response and compare both by taking the L2 norm of the error between two outputs obtained through the analytic (manual)...
 Can you Solve in matlab please. I need your help
B-7-6. Consider the system shown in Figure 7-59. Plot the root loci for the system. Determine the value of K such that the damping ratio ζ of the dominant closed-loop poles is 05. Then determine all closed-loop poles. Plot the unit-step response curve with MATLAB. s(s2 +4s +5) Figure 7-59 Control system.
B-7-6. Consider the system shown in Figure 7-59. Plot the root loci for the system. Determine the value...
Can you Solve in matlab please. I need your help
B-7-6. Consider the system shown in Figure 7-59. Plot the root loci for the system. Determine the value of K such that the damping ratio ζ of the dominant closed-loop poles is 05. Then determine all closed-loop poles. Plot the unit-step response curve with MATLAB. s(s2 +4s +5) Figure 7-59 Control system.
B-7-6. Consider the system shown in Figure 7-59. Plot the root loci for the system. Determine the value...
 please complete this project.
100 Consider the following LTI system, 5, and wo = 2000π rad/sec. where, Q a) Use MATLAB to determine magnitude response and phase response of the filter b) What type of filter is it? c) What will be the output of this filter if input x,(t)-5Cos(100t). Show all calculations step by step as shown in Lecture-20 d) Verify your answer of part (e) by using Simulink model. Attach the snapshot of Simulink model and output e)...
please complete this project.
100 Consider the following LTI system, 5, and wo = 2000π rad/sec. where, Q a) Use MATLAB to determine magnitude response and phase response of the filter b) What type of filter is it? c) What will be the output of this filter if input x,(t)-5Cos(100t). Show all calculations step by step as shown in Lecture-20 d) Verify your answer of part (e) by using Simulink model. Attach the snapshot of Simulink model and output e)...
 Clear steps, please.
Consider the following LTI system where, Q -5, and w 2000m rad./sec. a) Use MATLAB to determine magnitude response and phase response of the filter. b) What type of filter is it? c) What will be the output of this filter if input xio- 5Cos(1000). Show all calculations step by step as shown in Lecture-21 . d) Verify your answer of part (e) by using Simulink model. Attach the snapshot of Simulink model and output. e) What...
Clear steps, please.
Consider the following LTI system where, Q -5, and w 2000m rad./sec. a) Use MATLAB to determine magnitude response and phase response of the filter. b) What type of filter is it? c) What will be the output of this filter if input xio- 5Cos(1000). Show all calculations step by step as shown in Lecture-21 . d) Verify your answer of part (e) by using Simulink model. Attach the snapshot of Simulink model and output. e) What...
 Q4. 1 2 3 G 10 pts. Use MATLAB and plot the step response of the following systems G3 2s+1 figure. Gy on the same 2s+1 2s+1 Explain the similarities (at least 1) and differences (at least 1) between these responses. E_ figure. G, G 3 10 pts. Use MATLAB and plot the impulse response of the following systems Explain the similarities and differences between these responses. on the same 25+1 10 pts. Find the time constant (Te), pole(s), DC...
 control system
System Description: The figure 1 and 2 below show, respectively, components and block diagram of a motor and the measurements of velocity (via the tacho unit) and position (via the potentiometer). n represents the gearbox ratio between the rotating shaft and the output shaft. The left-hand side of the diagram represents the controller. A reference set point for the rotating shaft is entered in degrees and this is equivalent voltage. The error is calculated by subtracting the measured...
control system
System Description: The figure 1 and 2 below show, respectively, components and block diagram of a motor and the measurements of velocity (via the tacho unit) and position (via the potentiometer). n represents the gearbox ratio between the rotating shaft and the output shaft. The left-hand side of the diagram represents the controller. A reference set point for the rotating shaft is entered in degrees and this is equivalent voltage. The error is calculated by subtracting the measured...
 Please solve it with step by step MATLAB code, thank you!
Suppose that a system is shown in Figure 2. Based on for loop, write a piece of MATLAB code to calculate the closed loop poles for 03K35 and plot the outputs where the poles are represented by "W" letter. Find the interval of K parameter for stability using Routh-Hurwitz method. Calculate the poles of the closed loop transfer function where K attains the minimum value such that the system...
Please solve it with step by step MATLAB code, thank you!
Suppose that a system is shown in Figure 2. Based on for loop, write a piece of MATLAB code to calculate the closed loop poles for 03K35 and plot the outputs where the poles are represented by "W" letter. Find the interval of K parameter for stability using Routh-Hurwitz method. Calculate the poles of the closed loop transfer function where K attains the minimum value such that the system...
 please show work
thank you!
Use Matlab to and the SISOTool construct the system for analysis (You may want to preview the tf and sisotool commands from matlab by typing help tf or doc tf etc...) Each Block B1, B2, B3 and B4 will be constructed individually and then concatenated together As shown in the block diagram let K=0.1 Set B1 = 0.1 by typing in matlab >>B1=0.1 To assign the Blockl values use the TF command to construct a...
please show work
thank you!
Use Matlab to and the SISOTool construct the system for analysis (You may want to preview the tf and sisotool commands from matlab by typing help tf or doc tf etc...) Each Block B1, B2, B3 and B4 will be constructed individually and then concatenated together As shown in the block diagram let K=0.1 Set B1 = 0.1 by typing in matlab >>B1=0.1 To assign the Blockl values use the TF command to construct a...
 3. Consider a second order system with transfer fuction P(s) = 2-B2 with a = 4000 and ß = 25. Design a compensator assuming unity feedback for the gain and phase margins you apriori specify (try to achieve as high as possible). Compute the poles and zeros of the closed-loor system. Plot the Nyquist plot of your compensator and verify that the Nyquist criterion is satisfied. Plot the step response of the closed-loop system and specify maximum overshoot, peak time,...
 Problem 2 Wis) R(s) U(s) Gol (s) D a (s) E(s) H(s) Given a system as in the diagram above, use MATLAB to solve the problems: Assume we want the closed-loop system rise time to be t, 0.18 sec S + Z H(s) 1 Gpl)s(s+)et s(s 1) s + p a) Assume W(s)-0. Draw the root locus of the system assuming compensator consists only of the adjustable gain parameter K, i.e. Dct (s) Determine the approximate range of values of...
Most questions answered within 3 hours.
-
Where is the error in this code sequence?
String s1 = "Hello";
String s2 = "ello";...
asked 11 months ago -
Financial data for Joel de Paris, Inc., for last year
follow:
Joel de Paris, Inc.
Balance...
asked 11 months ago -
Consider this reaction:
Al2(SO4)3 (aq)+ BaCl3
(aq) Al2Cl6 (aq)- +
3BaSO4(s) . What is the...
asked 11 months ago -
Suppose that Savneet is considering increasing her
recent random sample from 20 car rentals to 40...
asked 11 months ago -
Trucks arrive at an unloading terminal at an average rate of 120
per hour.
Trucks arrive...
asked 11 months ago -
Why are methanol and ethanol completely soluble in water while
octanol is not very little soluble....
asked 11 months ago -
A facilities manager at a university reads in a research report
that the mean amount of...
asked 11 months ago -
When the CuSO4 is rehydrated by adding water to the anhydrous
compound, is this an endothermic...
asked 11 months ago -
A ray of sunlight is passing from diamond into crown glass; the
angle of incidence is...
asked 11 months ago -
A block of mass 0.249 kg is placed on top of a light, vertical
spring of...
asked 11 months ago -
how do the kidneys compensate in the presences of acidosis
a) trigger hyperventilate
b) reserve acid...
asked 11 months ago -
Question 501 pts
The rental rate of capital to the firm increases. Which of the
following...
asked 11 months ago