
Homework Answers
(A)
(1) Null and Alternative Hypotheses
The following null and alternative hypotheses need to be tested:
Ho: μ1 = μ2 = μ3 = μ4 = μ5 = μ6
Ha: Not all means are equal
The above hypotheses will be tested using an F-ratio for a One-Way ANOVA.
(2) Rejection Region
Based on the information provided, the significance level is \alpha = 0.05α=0.05, and the degrees of freedom are df_1 = 5df1=5 and df_2 = 5df2=5, therefore, the rejection region for this F-test is R = \{F: F > F_c = 2.711\}R={F:F>Fc=2.711}.
(3) Test Statistics
The following table is obtained:
| Group 1 | Group 2 | Group 3 | Group 4 | Group 5 | Group 6 | |
| 14.1 | 12.8 | 13.5 | 13.2 | 16.8 | 18.1 | |
| 13.6 | 12.5 | 13.4 | 12.7 | 17.2 | 17.2 | |
| 14.4 | 13.4 | 14.1 | 12.6 | 16.4 | 18.7 | |
| 14.3 | 13.0 | 14.3 | 14.1 | 17.3 | 18.4 | |
| 12.3 | 18.0 | |||||
| Sum = | 56.4 | 64 | 55.3 | 52.6 | 85.7 | 72.4 |
| Average = | 14.1 | 12.8 | 13.825 | 13.15 | 17.14 | 18.1 |
| \sum_i X_{ij}^2 =∑iXij2= | 795.62 | 819.94 | 765.11 | 693.1 | 1470.33 | 1311.7 |
| St. Dev. = | 0.356 | 0.43 | 0.443 | 0.686 | 0.598 | 0.648 |
| SS = | 0.37999999999988 | 0.74000000000001 | 0.58750000000009 | 1.4099999999999 | 1.4319999999998 | 1.2599999999998 |
| n = | 4 | 5 | 4 | 4 | 5 | 4 |
The total sample size is N = 26N=26. Therefore, the total degrees of freedom are:
dftotal=26−1=25
Also, the between-groups degrees of freedom are dfbetween=6−1=5, and the within-groups degrees of freedom are:
dfwithin=dftotal−dfbetween=25−5=20
First, we need to compute the total sum of values and the grand mean. The following is obtained
∑Xij=56.4+64+55.3+52.6+85.7+72.4=386.4
Also, the sum of squared values is
∑Xij2=795.62+819.94+765.11+693.1+1470.33+1311.7=5855.8
Based on the above calculations, the total sum of squares is computed as follows
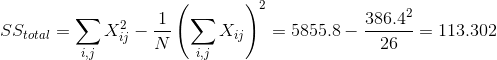
The within sum of squares is computed as shown in the calculation below:

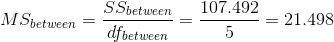


F=74.011
(4) Decision about the null hypothesis
Since it is observed that F=74.011>Fc=2.711, it is then concluded that the null hypothesis is rejected.
Using the P-value approach: The p-value is p=0(option(D) p<0.001) and since p=0<0.05, it is concluded that the null hypothesis is rejected.
(5) Conclusion
It is concluded that the null hypothesis Ho is rejected. Therefore, there is enough evidence to claim that not all 6 population means are equal, at the α=0.05 significance level.
option(B) is correct.
(B)
A=Imperial D=Chiffon
B=Parkey E=Mazola
C=Blue Bonnet F=Fleischmaan's
Tukey HSD results
| treatments pair |
Tukey HSD Q statistic |
Tukey HSD p-value |
Tukey HSD inferfence |
| A vs B | 5.0851 | 0.0192747 | * p<0.05 |
| A vs C | 1.0205 | 0.8999947 | insignificant |
| A vs D | 3.5253 | 0.1733858 | insignificant |
| A vs E | 11.8913 | 0.0010053 | ** p<0.01 |
| A vs F | 14.8435 | 0.0010053 | ** p<0.01 |
| B vs C | 4.0094 | 0.0922096 | insignificant |
| B vs D | 1.3691 | 0.8999947 | insignificant |
| B vs E | 18.0061 | 0.0010053 | ** p<0.01 |
| B vs F | 20.7315 | 0.0010053 | ** p<0.01 |
| C vs D | 2.5048 | 0.5038367 | insignificant |
| C vs E | 12.9670 | 0.0010053 | ** p<0.01 |
| C vs F | 15.8640 | 0.0010053 | ** p<0.01 |
| D vs E | 15.6073 | 0.0010053 | ** p<0.01 |
| D vs F | 18.3688 | 0.0010053 | ** p<0.01 |
| E vs F | 3.7551 | 0.1292520 | insignificant |
please rate my answer and comment for doubts.
Add Answer to:
Suppose samples of six different brands of diet or imitation margarine were analyzed to determine the...
Suppose samples of six different brands of diet or imitation margarine were analyzed to determine the...
 Suppose samples of six different brands of diet or imitation margarine were analyzed to determine the level of physiologically active polyunsaturated fatty acids (PAPUFA, in percent), resulting in the data shown in the accompanying table. Imperial 14.1 13.6 14.4 14.3 Parkay 12.8 12.5 13.4 13.0 12.3 Blue Bonnet 13.5 13.4 14.1 14.3 Chiffon 13.2 12.7 12.6 14.1 Mazola 16.8 17.2 16.4 17.3 18.0 17.2 18.7 18.4 Fleischmann's 18.1 (a) Test for differences among the true average PAPUFA percentages for the...
Suppose samples of six different brands of diet or imitation margarine were analyzed to determine the level of physiologically active polyunsaturated fatty acids (PAPUFA, in percent), resulting in the...
Suppose samples of six different brands of diet or imitation margarine were analyzed to determine the level of physiologically active polyunsaturated fatty acids (PAPUFA, in percent), resulting in the data shown in the accompanying table. Imperial 14.1 13.6 14.4 14.3 Parkay 12.8 12.5 13.4 13.0 12.3 Blue Bonnet 13.5 13.4 14.1 14.3 Chiffon 13.2 12.7 12.6 13.9 Mazola 16.8 17.3 16.4 17.3 18.0 Fleischmann's 18.1 17.2 18.7 18.4 (a) Test for differences among the true average PAPUFA percentages for the...
Suppose samples of six different brands of diet or imitation margarine were analyzed to determine the level of physiologically active polyunsaturated fatty acids (PAPUFA, in percent), resulting in the...
Suppose samples of six different brands of diet or imitation margarine were analyzed to determine the level of physiologically active polyunsaturated fatty acids (PAPUFA, in percent), resulting in the data shown in the accompanying table. Imperial 14.1 13.6 14.5 14.3 Parkay 12.8 12.5 13.4 13.0 12.3 Blue Bonnet 13.5 13.4 14.1 14.4 Chiffon 13.2 12.7 12.6 14.1 Mazola 16.8 17.2 16.4 17.3 18.0 Fleischmann's 18.1 17.2 18.7 18.4 Use the T-K procedure to compute 95% simultaneous confidence intervals for all...
Suppose the accompanying summary statistics for a measure of social marginality for samples of youths, young...
 Suppose the accompanying summary statistics for a measure of social marginality for samples of youths, young adults, adults, and seniors appeared in a research paper. The social marginality score measured actual and perceived social rejection, with higher scores indicating greater social rejection. Age Group Youths Young Adults Adults Seniors Sample Size X 107 2.00 255 3.30 3 13 3.09 32 2.83 1.57 1.68 1.69 1.86 For purposes of this exercise, assume that it is reasonable to regard the four samples...
An experiment was carried out to compare electrical resistivity for six different low-permeability concrete bridge deck...
An experiment was carried out to compare electrical resistivity for six different low-permeability concrete bridge deck mixtures. There were 26 measurements on concrete cylinders for each mixture; these were obtained 28 days after casting. The entries in the accompanying ANOVA table are based on information in an article. Fill in the remaining entries. (Round your answer for f to two decimal places.) Source df Sum of Squares Mean Square f Mixture Error 13.989 Total 5664.495 Test appropriate hypotheses at level...
1.An experiment was carried out to compare electrical resistivity for six different low-permeability concrete bridge deck...
1.An experiment was carried out to compare electrical resistivity for six different low-permeability concrete bridge deck mixtures. There were 26 measurements on concrete cylinders for each mixture; these were obtained 28 days after casting. The entries in the accompanying ANOVA table are based on information in an article. Fill in the remaining entries. (Round your answer for f to two decimal places.) Source df sum of squares mean square f Mixture : _____ _____________ __________ ____ Error : ______ _____________...
1. The lumen output was determined for each of I = 3 different brands of lightbulbs having the sa...
1. The lumen output was determined for each of I = 3 different brands of lightbulbs having the same wattage, with J = 8 bulbs of each brand tested. The sums of squares were computed as SSE = 4775.1 and SSTr = 590.8. State the hypotheses of interest (including word definitions of parameters). A) μi = true average lumen output for brand i bulbs H0: μ1 = μ2 = μ3 Ha: at least two μi's are unequal B) μi =...
Problem 3 A particular brand of diet margarine was analyzed to determine the level of polyunsatur...
 Problem 3
A particular brand of diet margarine was analyzed to determine
the level of polyunsaturated fatty acid (in percentages). A sample
of six packages resulted in the following data: 16.8, 17.2, 17.4,
16.9, 16.5, 17.1.
Question 7 0.5 pts For problem 3 what is the p-value? Almost zero Between 0.01 and 0.025 Between 0.025 and 0.05 Between 0.4 and 0.5 Question8 0.5 pts For problem 3, at a significance level of a-0.05, the company should fail to reject the...
Problem 3
A particular brand of diet margarine was analyzed to determine
the level of polyunsaturated fatty acid (in percentages). A sample
of six packages resulted in the following data: 16.8, 17.2, 17.4,
16.9, 16.5, 17.1.
Question 7 0.5 pts For problem 3 what is the p-value? Almost zero Between 0.01 and 0.025 Between 0.025 and 0.05 Between 0.4 and 0.5 Question8 0.5 pts For problem 3, at a significance level of a-0.05, the company should fail to reject the...
1. In an experiment to compare the tensile strengths of 1 - 6 different types of...
 1. In an experiment to compare the tensile strengths of 1 - 6 different types of copper wire, ) = 5 samples of each type were used. The between-samples and within samples estimates of a were computed as MSTR = 2649.3 and MSE - 1169.2, respectively. Use the F test at level 0.05 to test Ho: H1 12 - ... - versus Ha: at least two wi's are unequal Calculate the test statistic (Round your answer to two decimal places.)...
s samples of each of our types of cereal grain grown in a certain region were...
 s samples of each of our types of cereal grain grown in a certain region were analyzed to determine am n content, resulting in the following data ㎍/g Note: If you want to use R this data has been set up so you may copy ıt d ec y into R Wheat- 5.1, 4.4, 6.1, 6.2, 6.6, 5.7) Sarley- 6.5, 7.9, 6.0, 7.5, 5.8, 5.7) Maize- 5.8, 4.7, 6.5, 5.0, 6.1, 5.3) Oats- 8.2, 6.0, 7.7, 6.9, 5.4, 7.2 In...
 Suppose samples of six different brands of diet or imitation margarine were analyzed to determine the level of physiologically active polyunsaturated fatty acids (PAPUFA, in percent), resulting in the data shown in the accompanying table. Imperial 14.1 13.6 14.4 14.3 Parkay 12.8 12.5 13.4 13.0 12.3 Blue Bonnet 13.5 13.4 14.1 14.3 Chiffon 13.2 12.7 12.6 14.1 Mazola 16.8 17.2 16.4 17.3 18.0 17.2 18.7 18.4 Fleischmann's 18.1 (a) Test for differences among the true average PAPUFA percentages for the...
 Suppose the accompanying summary statistics for a measure of social marginality for samples of youths, young adults, adults, and seniors appeared in a research paper. The social marginality score measured actual and perceived social rejection, with higher scores indicating greater social rejection. Age Group Youths Young Adults Adults Seniors Sample Size X 107 2.00 255 3.30 3 13 3.09 32 2.83 1.57 1.68 1.69 1.86 For purposes of this exercise, assume that it is reasonable to regard the four samples...
 Problem 3
A particular brand of diet margarine was analyzed to determine
the level of polyunsaturated fatty acid (in percentages). A sample
of six packages resulted in the following data: 16.8, 17.2, 17.4,
16.9, 16.5, 17.1.
Question 7 0.5 pts For problem 3 what is the p-value? Almost zero Between 0.01 and 0.025 Between 0.025 and 0.05 Between 0.4 and 0.5 Question8 0.5 pts For problem 3, at a significance level of a-0.05, the company should fail to reject the...
Problem 3
A particular brand of diet margarine was analyzed to determine
the level of polyunsaturated fatty acid (in percentages). A sample
of six packages resulted in the following data: 16.8, 17.2, 17.4,
16.9, 16.5, 17.1.
Question 7 0.5 pts For problem 3 what is the p-value? Almost zero Between 0.01 and 0.025 Between 0.025 and 0.05 Between 0.4 and 0.5 Question8 0.5 pts For problem 3, at a significance level of a-0.05, the company should fail to reject the...
 1. In an experiment to compare the tensile strengths of 1 - 6 different types of copper wire, ) = 5 samples of each type were used. The between-samples and within samples estimates of a were computed as MSTR = 2649.3 and MSE - 1169.2, respectively. Use the F test at level 0.05 to test Ho: H1 12 - ... - versus Ha: at least two wi's are unequal Calculate the test statistic (Round your answer to two decimal places.)...
 s samples of each of our types of cereal grain grown in a certain region were analyzed to determine am n content, resulting in the following data ㎍/g Note: If you want to use R this data has been set up so you may copy ıt d ec y into R Wheat- 5.1, 4.4, 6.1, 6.2, 6.6, 5.7) Sarley- 6.5, 7.9, 6.0, 7.5, 5.8, 5.7) Maize- 5.8, 4.7, 6.5, 5.0, 6.1, 5.3) Oats- 8.2, 6.0, 7.7, 6.9, 5.4, 7.2 In...
Most questions answered within 3 hours.
-
Where is the error in this code sequence?
String s1 = "Hello";
String s2 = "ello";...
asked 11 months ago -
Financial data for Joel de Paris, Inc., for last year
follow:
Joel de Paris, Inc.
Balance...
asked 11 months ago -
Consider this reaction:
Al2(SO4)3 (aq)+ BaCl3
(aq) Al2Cl6 (aq)- +
3BaSO4(s) . What is the...
asked 11 months ago -
Suppose that Savneet is considering increasing her
recent random sample from 20 car rentals to 40...
asked 11 months ago -
Trucks arrive at an unloading terminal at an average rate of 120
per hour.
Trucks arrive...
asked 11 months ago -
Why are methanol and ethanol completely soluble in water while
octanol is not very little soluble....
asked 11 months ago -
A facilities manager at a university reads in a research report
that the mean amount of...
asked 11 months ago -
When the CuSO4 is rehydrated by adding water to the anhydrous
compound, is this an endothermic...
asked 11 months ago -
A ray of sunlight is passing from diamond into crown glass; the
angle of incidence is...
asked 11 months ago -
A block of mass 0.249 kg is placed on top of a light, vertical
spring of...
asked 11 months ago -
how do the kidneys compensate in the presences of acidosis
a) trigger hyperventilate
b) reserve acid...
asked 11 months ago -
Question 501 pts
The rental rate of capital to the firm increases. Which of the
following...
asked 11 months ago