
Homework Answers

Add Answer to:
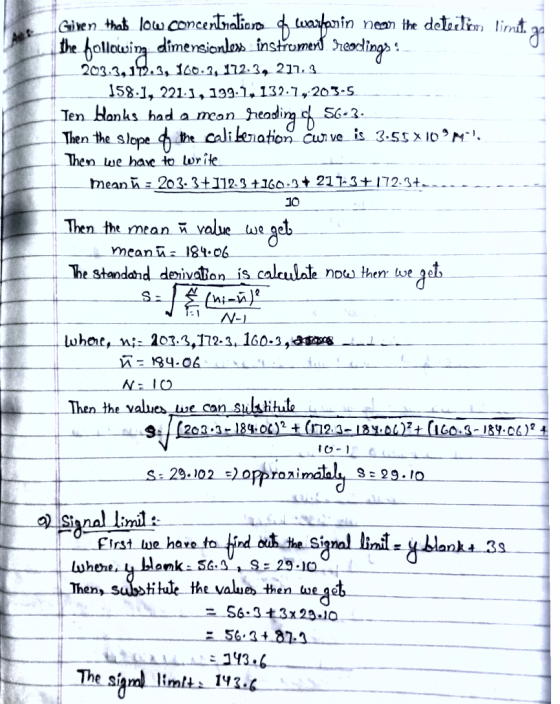
Low concentrations of warfarin near the detection limit gave the dimensionless instrument readings: 203.3, 172.3, 160.3,...
Help!!! :( Low concentrations of thallium near the detection limit gave the following dimensionless instrument readings:...
 Help!!! :(
Low concentrations of thallium near the detection limit gave the following dimensionless instrument readings: 206.9,173.7.163.9,175.9, 220.9.161.7, 224.7, 203.3,136.3, and 207.1. Ten blanks had a mean reading of 42.1. The slope of the calibration curve is 1.76 times 10^9M^-1. Estimate the signal and concentration detection limits and the lower limit of quantitation for thallium. Signal Detection Limit: Concentration Detection Limit: Lower Limit of Quantitation:
Help!!! :(
Low concentrations of thallium near the detection limit gave the following dimensionless instrument readings: 206.9,173.7.163.9,175.9, 220.9.161.7, 224.7, 203.3,136.3, and 207.1. Ten blanks had a mean reading of 42.1. The slope of the calibration curve is 1.76 times 10^9M^-1. Estimate the signal and concentration detection limits and the lower limit of quantitation for thallium. Signal Detection Limit: Concentration Detection Limit: Lower Limit of Quantitation:
A researcher is interested in determining the detection and quantitation limits of a method for the...
A researcher is interested in determining the detection and quantitation limits of a method for the detection of warfarin. Ten method blanks gave the dimensionless instrument readings: 72.3 , 34.1 , 29.3 , 41.3 , 86.3 , 27.1 , 79.1 , 64.7 , 31.7 , and 72.5 . Ten samples containing a low concentration of warfarin near the detection limit had a mean reading of 189.1 . The slope of the calibration curve is 2.50×10⁹ M−1 . Estimate the signal...
Find the detection limit for a low concentration of analyte in mu M (to 2 significant...
 Find the detection limit for a low concentration of analyte in mu M (to 2 significant figures), if the reagent blanks gave values of a detector signal of 1.4, 2.2, 1.7, 0.9, 0.4, 1.5, and 0.7 nA, and the slope of the calibration curve was m = 0.229 nA/ mu M.
 Help!!! :(
Low concentrations of thallium near the detection limit gave the following dimensionless instrument readings: 206.9,173.7.163.9,175.9, 220.9.161.7, 224.7, 203.3,136.3, and 207.1. Ten blanks had a mean reading of 42.1. The slope of the calibration curve is 1.76 times 10^9M^-1. Estimate the signal and concentration detection limits and the lower limit of quantitation for thallium. Signal Detection Limit: Concentration Detection Limit: Lower Limit of Quantitation:
Help!!! :(
Low concentrations of thallium near the detection limit gave the following dimensionless instrument readings: 206.9,173.7.163.9,175.9, 220.9.161.7, 224.7, 203.3,136.3, and 207.1. Ten blanks had a mean reading of 42.1. The slope of the calibration curve is 1.76 times 10^9M^-1. Estimate the signal and concentration detection limits and the lower limit of quantitation for thallium. Signal Detection Limit: Concentration Detection Limit: Lower Limit of Quantitation:
 Find the detection limit for a low concentration of analyte in mu M (to 2 significant figures), if the reagent blanks gave values of a detector signal of 1.4, 2.2, 1.7, 0.9, 0.4, 1.5, and 0.7 nA, and the slope of the calibration curve was m = 0.229 nA/ mu M.
Most questions answered within 3 hours.
-
Where is the error in this code sequence?
String s1 = "Hello";
String s2 = "ello";...
asked 11 months ago -
Financial data for Joel de Paris, Inc., for last year
follow:
Joel de Paris, Inc.
Balance...
asked 11 months ago -
Consider this reaction:
Al2(SO4)3 (aq)+ BaCl3
(aq) Al2Cl6 (aq)- +
3BaSO4(s) . What is the...
asked 11 months ago -
Suppose that Savneet is considering increasing her
recent random sample from 20 car rentals to 40...
asked 11 months ago -
Trucks arrive at an unloading terminal at an average rate of 120
per hour.
Trucks arrive...
asked 11 months ago -
Why are methanol and ethanol completely soluble in water while
octanol is not very little soluble....
asked 11 months ago -
A facilities manager at a university reads in a research report
that the mean amount of...
asked 11 months ago -
When the CuSO4 is rehydrated by adding water to the anhydrous
compound, is this an endothermic...
asked 11 months ago -
A ray of sunlight is passing from diamond into crown glass; the
angle of incidence is...
asked 11 months ago -
A block of mass 0.249 kg is placed on top of a light, vertical
spring of...
asked 11 months ago -
how do the kidneys compensate in the presences of acidosis
a) trigger hyperventilate
b) reserve acid...
asked 11 months ago -
Question 501 pts
The rental rate of capital to the firm increases. Which of the
following...
asked 11 months ago