
Homework Answers
a)


b)


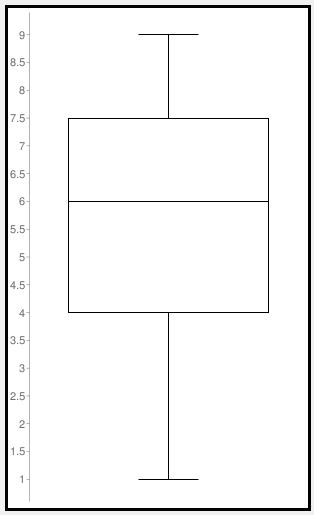
c) Box plot:
Add Answer to:
Tutorial Exercise Consider the following ordered data. 1 4 4 5 6 6 7 8 9...
Consider the sample: 9, 6, 7, 9, 10, 8 a) Find : the mean, the median,...
Consider the sample: 9, 6, 7, 9, 10, 8 a) Find : the mean, the median, the mode b) Find : the range, the quartiles Q1, Q3, the variance, the standard deviation. c) Draw a box-plot for the given data set.
(2) Consider the sample: 9, 6. 7, 9, 10, 8 a) Find: the mean, the median,...
 (2) Consider the sample: 9, 6. 7, 9, 10, 8 a) Find: the mean, the median, the mode b) Find: the range, the quartiles Q1, Q3, the variance, the standard deviation c) Draw a box-plot for the given data set.
A random sample of 24 professors at Montana State University gave the following ages (years) 29...
A random sample of 24 professors at Montana State University gave the following ages (years) 29 32 56 61 27 43 38 65 36 47 41 68 59 40 33 35 44 39 28 46 42 62 58 45 (a) Give the five number summary including the low value, Q1, median, Q3, and high value. (b) Make a box-and-whisker plot for the data. (c) Find the interquartile range.
A random sample of 24 professors at Montana State University gave the following ages (years) 29...
A random sample of 24 professors at Montana State University gave the following ages (years) 29 32 56 61 27 43 38 65 36 47 41 68 59 40 33 35 44 39 28 46 42 62 58 45 (a) Give the five number summary including the low value, Q1, median, Q3, and high value. (b) Make a box-and-whisker plot for the data. (c) Find the interquartile range
1. Consider the following data: 18, 20, 25, 31, 32, 38, 39, 40, 43, 49, 51,...
1. Consider the following data: 18, 20, 25, 31, 32, 38, 39, 40, 43, 49, 51, 54, 65, 74 Use 4 classes. a. Class width : b. Complete the following table. ????? ?????? ????? − ????? Class Boundaries Midpoint Frequencies Relative Frequencies Cumulative Frequencies c. Draw a histogram. d. Draw a relative frequency histogram. e. Make a stem-and-leaf display. f. Find the interquartile range. g. Make a box-and-whisker plot. h. Determine the distribution shape. Please comment on all three plots....
For the following data: (sorted) 3 4 5 8 8 10 12 12 20 22 a) Calculate 1) Average or average 6) The Range 2) The median...
For the following data: (sorted) 3 4 5 8 8 10 12 12 20 22 a) Calculate 1) Average or average 6) The Range 2) The median 7) The Intercuartilico range 3) Fashion 8) Variance 4) The middle range 9) Standard deviation 5) The middle axis 10) the coefficient of variation B. Prepare a Graphic Box Plot (Box and Wisker) C. Determine border values or near atypical numbers (outliers) D) answer whether or not there are atypical numbers. What are...
ents NewOH LOUIS WOIR Unit riptive measures Unit 2.4 Skewness and Standard Deviation 2.4 Skewness and...
 ents NewOH LOUIS WOIR Unit riptive measures Unit 2.4 Skewness and Standard Deviation 2.4 Skewness and Standard Deviation A Construct and understand box-and-whisker plots Question A data set lists the number of hours each student, from a finance class, studied for a midterm. For this data set, the minimum is 3, the median is 6, the third quartile is 9, the interquartile range is 5, and the maximum is 17. Construct a box- and-whisker plot that shows the number of...
please answer number 6. 7. and 8. only Birthweight for girls was compared to boys in...
 please answer number 6. 7. and 8. only
Birthweight for girls was compared to boys in the month of July in MoristoWn Hospital. S. Boys: 8, 6, 4, 7, 8, 9, 10, 7, 8, 7, 5, 4, 8, 8 and 9 lbs 4, 6, 7, 8, 10, 9, 8, 4, 5, 8, 4, 6, 7,9 and 9 lbs Girs: Describe the data for both sets: Girls Вoys 7,2 6.9 7 Меan Median 4,1.9 Mode Standard Deviation (sample) Q1 Q3 Skewness...
please answer number 6. 7. and 8. only
Birthweight for girls was compared to boys in the month of July in MoristoWn Hospital. S. Boys: 8, 6, 4, 7, 8, 9, 10, 7, 8, 7, 5, 4, 8, 8 and 9 lbs 4, 6, 7, 8, 10, 9, 8, 4, 5, 8, 4, 6, 7,9 and 9 lbs Girs: Describe the data for both sets: Girls Вoys 7,2 6.9 7 Меan Median 4,1.9 Mode Standard Deviation (sample) Q1 Q3 Skewness...
1. Consider the following POPULATION of quiz scores {18, 23, 7, 20, 15, 12, 6, 23,...
 1. Consider the following POPULATION of quiz scores {18, 23, 7,
20, 15, 12, 6, 23, 17, 16 }
Compute the following: the mean ,μ, the variance, σ2, the
standarddeviation, σ.
State the mode, if one exists __________
ApplytheEmpiricalRuleatthe95%level.
What percentage of these Quiz Scores actually lie within the
interval found in part c? _________________________
II. Again consider the given Quiz Scores: {18, 23, 7, 20, 15,
12, 6, 23, 17, 16 }
Determine Q1, the median, and Q3:
Draw...
1. Consider the following POPULATION of quiz scores {18, 23, 7,
20, 15, 12, 6, 23, 17, 16 }
Compute the following: the mean ,μ, the variance, σ2, the
standarddeviation, σ.
State the mode, if one exists __________
ApplytheEmpiricalRuleatthe95%level.
What percentage of these Quiz Scores actually lie within the
interval found in part c? _________________________
II. Again consider the given Quiz Scores: {18, 23, 7, 20, 15,
12, 6, 23, 17, 16 }
Determine Q1, the median, and Q3:
Draw...
as soon as possible 1. Find Median, Q1, Q3, and the Interquartile range(IQR) 2 5 9...
 as soon as possible
1. Find Median, Q1, Q3, and the Interquartile range(IQR) 2 5 9 11 15 16 17 19 20 O 16;5;17:20 17:11:19;8 15;7; 18:11 15:11:17:6
as soon as possible
1. Find Median, Q1, Q3, and the Interquartile range(IQR) 2 5 9 11 15 16 17 19 20 O 16;5;17:20 17:11:19;8 15;7; 18:11 15:11:17:6
 (2) Consider the sample: 9, 6. 7, 9, 10, 8 a) Find: the mean, the median, the mode b) Find: the range, the quartiles Q1, Q3, the variance, the standard deviation c) Draw a box-plot for the given data set.
 ents NewOH LOUIS WOIR Unit riptive measures Unit 2.4 Skewness and Standard Deviation 2.4 Skewness and Standard Deviation A Construct and understand box-and-whisker plots Question A data set lists the number of hours each student, from a finance class, studied for a midterm. For this data set, the minimum is 3, the median is 6, the third quartile is 9, the interquartile range is 5, and the maximum is 17. Construct a box- and-whisker plot that shows the number of...
 please answer number 6. 7. and 8. only
Birthweight for girls was compared to boys in the month of July in MoristoWn Hospital. S. Boys: 8, 6, 4, 7, 8, 9, 10, 7, 8, 7, 5, 4, 8, 8 and 9 lbs 4, 6, 7, 8, 10, 9, 8, 4, 5, 8, 4, 6, 7,9 and 9 lbs Girs: Describe the data for both sets: Girls Вoys 7,2 6.9 7 Меan Median 4,1.9 Mode Standard Deviation (sample) Q1 Q3 Skewness...
please answer number 6. 7. and 8. only
Birthweight for girls was compared to boys in the month of July in MoristoWn Hospital. S. Boys: 8, 6, 4, 7, 8, 9, 10, 7, 8, 7, 5, 4, 8, 8 and 9 lbs 4, 6, 7, 8, 10, 9, 8, 4, 5, 8, 4, 6, 7,9 and 9 lbs Girs: Describe the data for both sets: Girls Вoys 7,2 6.9 7 Меan Median 4,1.9 Mode Standard Deviation (sample) Q1 Q3 Skewness...
 1. Consider the following POPULATION of quiz scores {18, 23, 7,
20, 15, 12, 6, 23, 17, 16 }
Compute the following: the mean ,μ, the variance, σ2, the
standarddeviation, σ.
State the mode, if one exists __________
ApplytheEmpiricalRuleatthe95%level.
What percentage of these Quiz Scores actually lie within the
interval found in part c? _________________________
II. Again consider the given Quiz Scores: {18, 23, 7, 20, 15,
12, 6, 23, 17, 16 }
Determine Q1, the median, and Q3:
Draw...
1. Consider the following POPULATION of quiz scores {18, 23, 7,
20, 15, 12, 6, 23, 17, 16 }
Compute the following: the mean ,μ, the variance, σ2, the
standarddeviation, σ.
State the mode, if one exists __________
ApplytheEmpiricalRuleatthe95%level.
What percentage of these Quiz Scores actually lie within the
interval found in part c? _________________________
II. Again consider the given Quiz Scores: {18, 23, 7, 20, 15,
12, 6, 23, 17, 16 }
Determine Q1, the median, and Q3:
Draw...
 as soon as possible
1. Find Median, Q1, Q3, and the Interquartile range(IQR) 2 5 9 11 15 16 17 19 20 O 16;5;17:20 17:11:19;8 15;7; 18:11 15:11:17:6
as soon as possible
1. Find Median, Q1, Q3, and the Interquartile range(IQR) 2 5 9 11 15 16 17 19 20 O 16;5;17:20 17:11:19;8 15;7; 18:11 15:11:17:6
Most questions answered within 3 hours.
-
Where is the error in this code sequence?
String s1 = "Hello";
String s2 = "ello";...
asked 10 months ago -
Financial data for Joel de Paris, Inc., for last year
follow:
Joel de Paris, Inc.
Balance...
asked 10 months ago -
Consider this reaction:
Al2(SO4)3 (aq)+ BaCl3
(aq) Al2Cl6 (aq)- +
3BaSO4(s) . What is the...
asked 10 months ago -
Suppose that Savneet is considering increasing her
recent random sample from 20 car rentals to 40...
asked 10 months ago -
Trucks arrive at an unloading terminal at an average rate of 120
per hour.
Trucks arrive...
asked 10 months ago -
Why are methanol and ethanol completely soluble in water while
octanol is not very little soluble....
asked 10 months ago -
A facilities manager at a university reads in a research report
that the mean amount of...
asked 10 months ago -
When the CuSO4 is rehydrated by adding water to the anhydrous
compound, is this an endothermic...
asked 10 months ago -
A ray of sunlight is passing from diamond into crown glass; the
angle of incidence is...
asked 10 months ago -
A block of mass 0.249 kg is placed on top of a light, vertical
spring of...
asked 10 months ago -
how do the kidneys compensate in the presences of acidosis
a) trigger hyperventilate
b) reserve acid...
asked 10 months ago -
Question 501 pts
The rental rate of capital to the firm increases. Which of the
following...
asked 10 months ago